pilot geographies
city of los angeles prototype
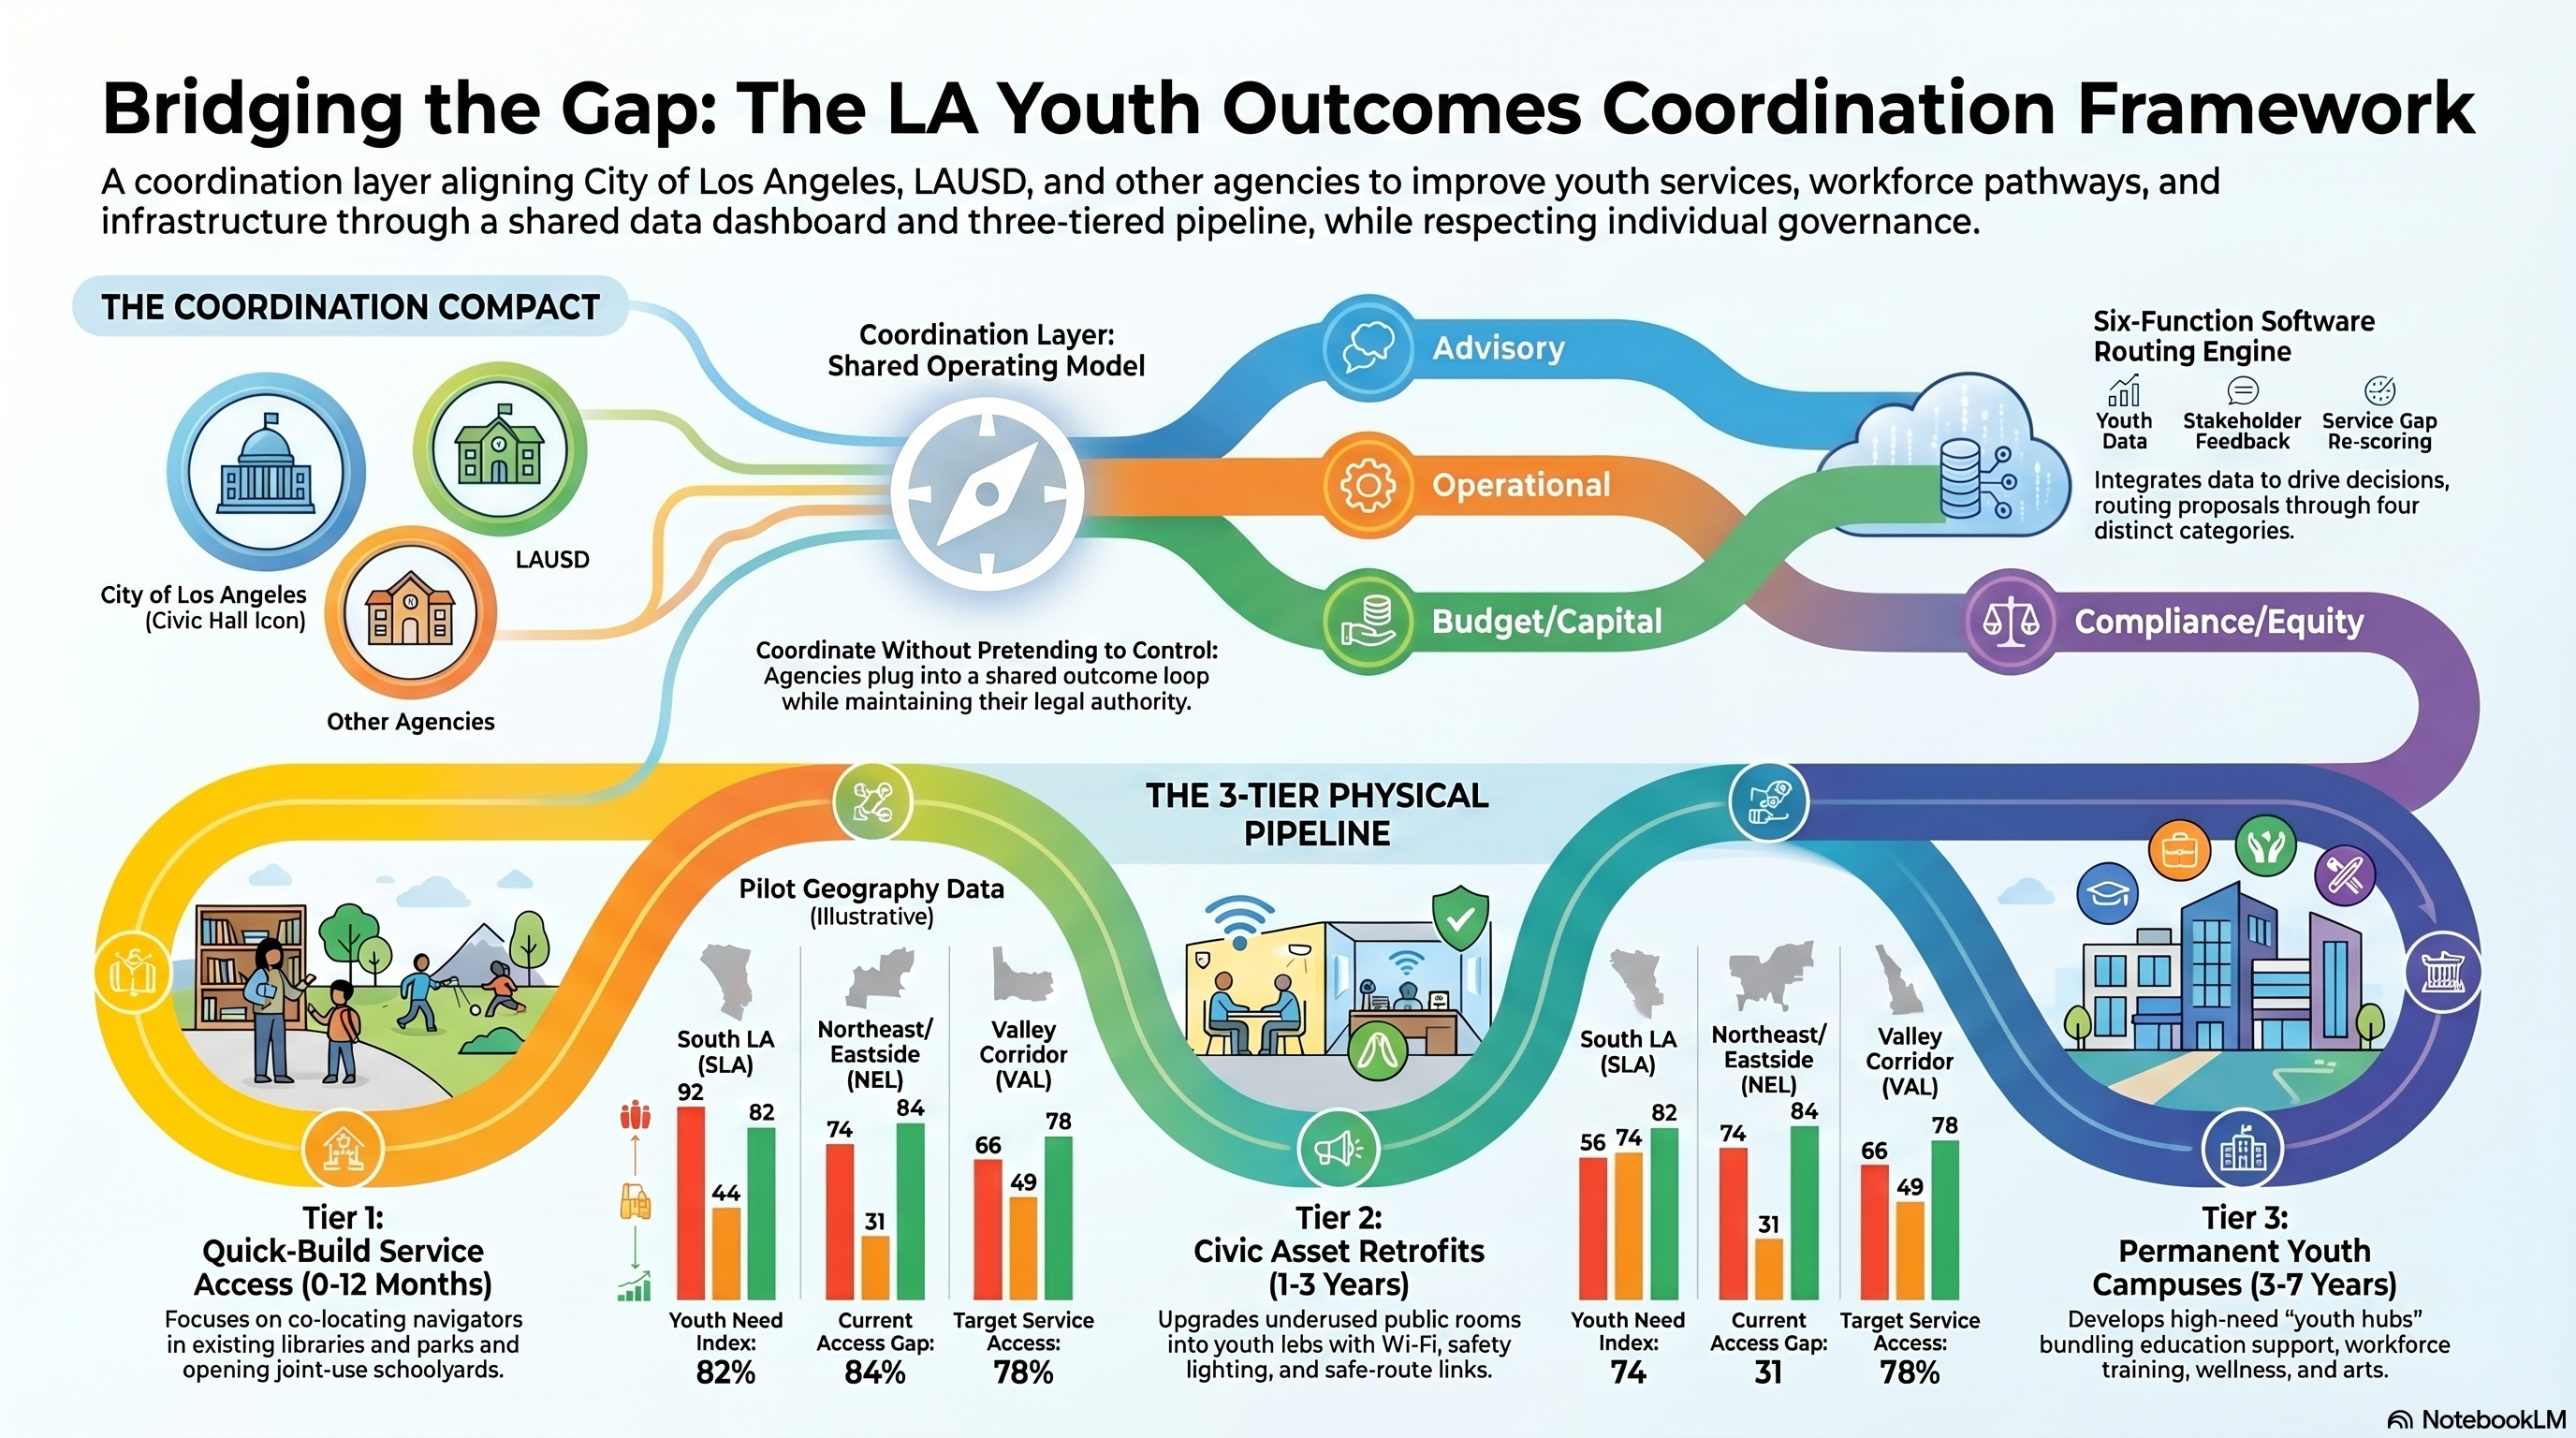
LA Youth Outcomes Coordination Framework
A civic operating model and interactive dashboard for aligning youth services, school access, workforce pathways, public facilities, and capital improvements. The City of Los Angeles does not govern LAUSD; this framework is a coordination layer between legally distinct authorities.
software-layer functions
decision pathways
infrastructure timelines
coordination framework
The compact, routing engine, and physical pipeline on one page
The visual packet frames the City, LAUSD, and agency compact as a shared operating layer: advisory, operational, budget/capital, and compliance/equity pathways feed a three-tier youth infrastructure pipeline without collapsing each institution's legal authority.
spatial diagnosis
Where need, services, transit, and civic assets overlap
Prototype GIS layers show youth need, school/program access, service assets, safe-route gaps, and proposed hub catchments. Live integration should pull from YDD dashboards, Earn Learn Play, LAUSD School Explorer, transit feeds, and City facility inventories.
Map source: prototype illustrative data modeled from official LA youth/service sources listed below.
performance dashboard
Funding, readiness, access gaps, and decision authority
Decision authority matrix
decision type lead signal binding owner output Advisory recommendationsYouth councils + familiesYDD publishes responseNonbinding community signalOperational coordinationYDD + departmentsCity departments / LAUSD partnersReferral, staffing, calendar, service pathBudget / capital routingMayor, Council, LAUSD board, County boardsLegal budget authorityAppropriation, MOU, capital projectCompliance / equity escalationCity Attorney, LAUSD counsel, privacy leadsResponsible public agencyFERPA, privacy, Brown Act, ADA, equity review
institutional restructure
A compact, not a takeover
The operating model creates a City-LAUSD-LACOE Youth Outcomes Compact: nonbinding public commitments, shared service inventory, clear owner-of-record fields, and quarterly reporting.
YDD
Own shared inventory, youth standards, public dashboard, quarterly commitments.
LAUSD
Keep authority over schools, instruction, board policy, attendance-boundary tools, and district operations.
LACOE
Coordinate countywide education support and vulnerable-youth systems.
EWDD
Operate YouthSource and youth employment pathways.
RAP / LAPL
Host youth hubs, library labs, recreation access, and joint programming.
CBOs
Deliver culturally competent services and report capacity/utilization.
Youth councils
Review service gaps, test language, and publish advisory findings.
software layer
The prototype becomes a routing engine
Research intake
Load youth need, program capacity, school access, transit reach, facility inventory, and public commitments.
Stakeholder feedback
Collect advisory input by youth, family, provider, department, school, and neighborhood role.
Decision routing
Classify each proposal as advisory, operational, budget/capital, or compliance/equity.
Community feed
Publish commitments, meeting notes, unresolved blockers, and youth/family comments.
Refinement loop
Re-score service gaps after each pilot cycle and flag underperforming commitments.
Deployment package
Export a neighborhood packet with maps, charts, owners, timeline, costs, and next decision.
physical infrastructure plan
Turn coordination into places families can actually use
Quick-build service access
MOUs, room scheduling, staffing calendars, data inventory
- Co-locate YDD navigators in libraries, parks, YouthSource centers, and selected schools
- Open joint-use schoolyards after hours where agreements already exist
- Create mobile service days in service deserts
Retrofit underused civic assets
Capital improvement scopes, safety upgrades, operating agreements
- Convert underused public rooms into youth labs
- Add shade, lighting, bathrooms, Wi-Fi, storage, and secure access
- Build safe-route links between schools, libraries, parks, and transit stops
Permanent youth/civic campuses
Acquisition, bond-capital alignment, joint development, philanthropic match
- Build or acquire permanent youth hubs in high-need service deserts
- Bundle education support, workforce, wellness, arts, and family navigation
- Tie capital renewal to published outcome commitments
90-day pilot
Three geographies, one operating cycle
South LA
High youth need and workforce-access priority
- need
- 92
- access gap
- 44
- target access
- 82%
Northeast / Eastside
School, transit, and park-access coordination
- need
- 74
- access gap
- 31
- target access
- 84%
Valley corridor
Distance, heat, and distributed-service challenge
- need
- 66
- access gap
- 49
- target access
- 78%
Sources and implementation note
This page uses prototype illustrative data for the first static build. A production version should replace these arrays with regularly updated public exports and label the date, owner, and quality status of each layer.