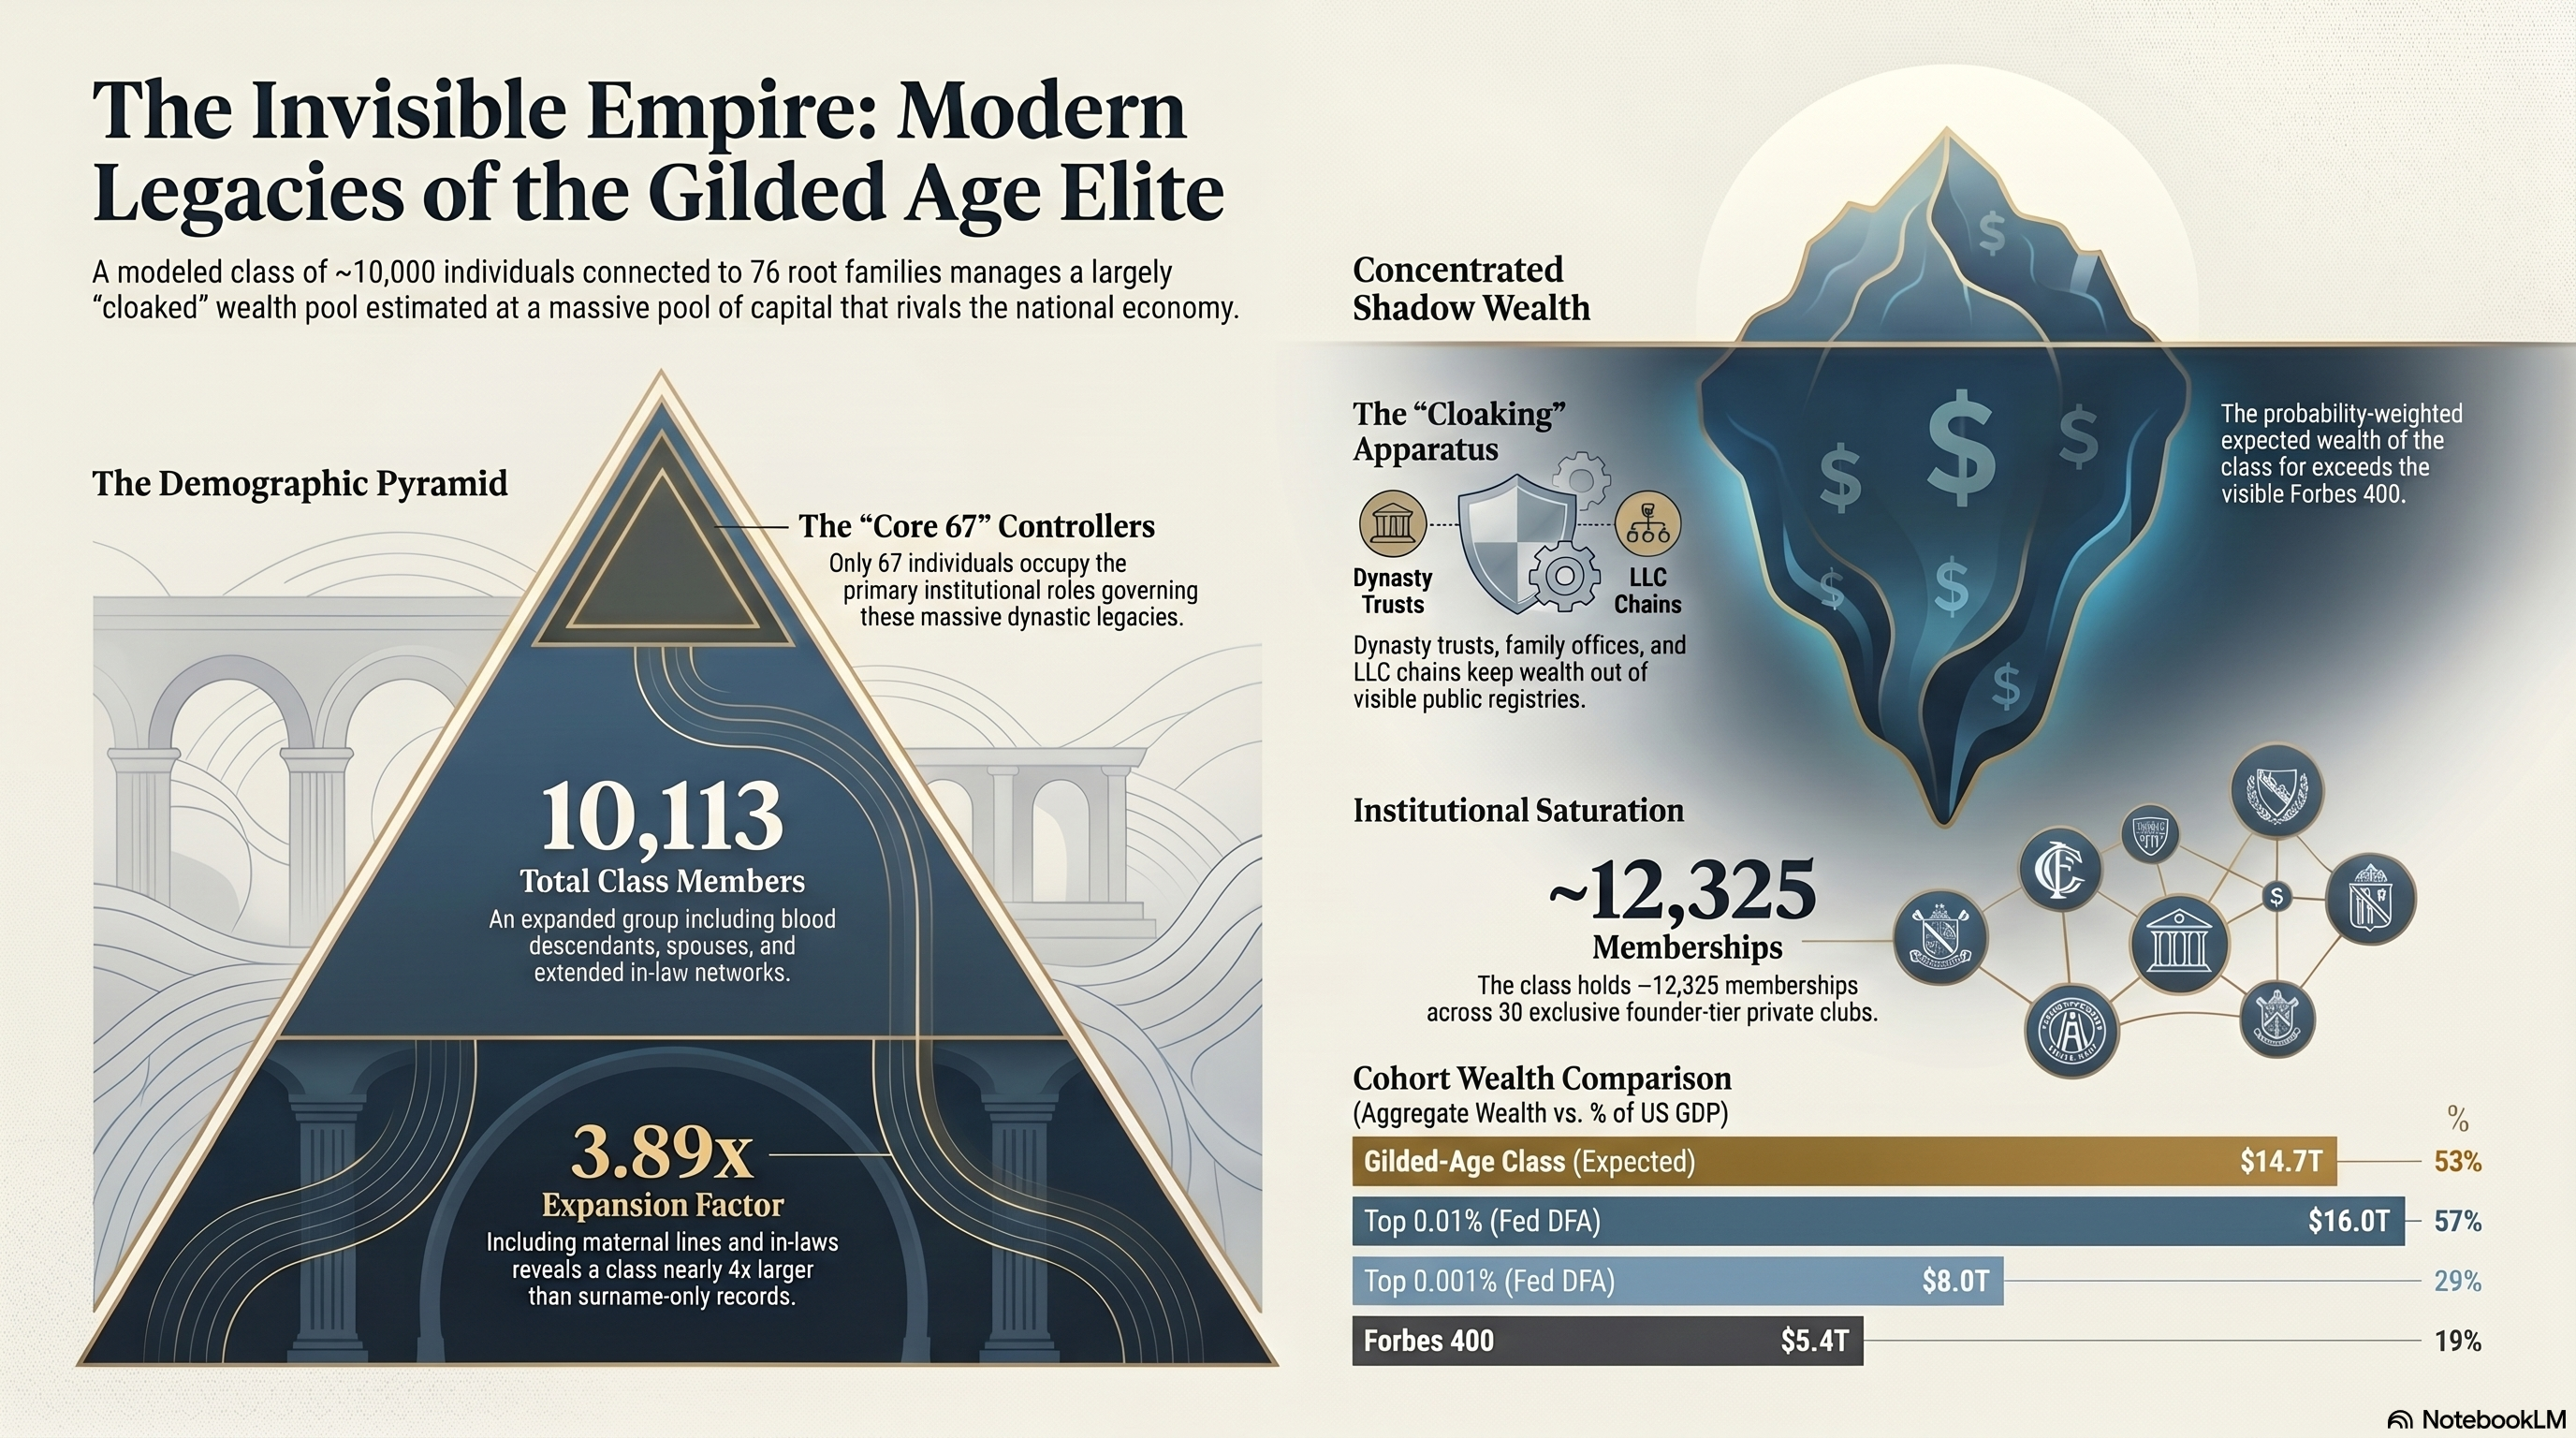
Infographic 'The Invisible Empire: Modern Legacies of the Gilded Age Elite' — demographic pyramid with 67 core controllers atop 10,113 total class members and a 3.89x expansion factor, an iceberg illustrating concentrated shadow wealth held through dynasty trusts, family offices, and LLC chains, ~12,325 memberships across 30 founder-tier private clubs, and a cohort wealth comparison placing the Gilded-Age class at $14.7T (53% of US GDP) above the Forbes 400 ($5.4T) and Fed DFA top 0.001% ($8.0T), just below the top 0.01% ($16.0T) ↗ open full size

companion overview

America's Hidden $14 Trillion Dynasties

NotebookLM overview, generated from this study

demographic model · gilded age fortunes · 2026

the gilded-age elite class demographic model

A bottom-up projection of how many people today are economically or institutionally connected to fortunes that cemented during the Gilded Age (1870 - 1914). The model starts from 76 root families, simulates descendants over six generations with documented fertility and extinction patterns, overlays marriage alliances, and classifies the living class into core controllers, peripheral inheritors, and symbolic heirs. All numbers are scenario ranges, not a census.

10,113 expanded class · central scenario
67 core controller role count
$1.3T - $3.4T collective wealth · documented + plausibly cloaked (realistic band)
$14.7T probability-weighted expected value · ~53% of 2026 US GDP

headline finding

The class is wider than its surname trail. The wealth is wider than its visible registries show.

With the long-tail of regional dynasties, maternal-line descendants who lost the surname, and the in-law network folded in, the model places the living class between 3,449 and 30,018 people across the conservative-expansive bracket (central 10,113). Of that, only roughly 39 to 98 occupy core institutional controller roles.

On wealth, the visible-only reading is misleading and the model now states the full range explicitly. Documented identifiable holdings are $300B - $600B in 2026 dollars — but the cloaking apparatus catalogued in the article (dynasty trusts, single- and multi-family offices, foundations, LP positions, LLC chains, donor-advised funds) is designed precisely to keep wealth out of those registries. A bottom-up cloaking estimate puts total class holdings at $1.3T - $3.4T (realistic), with an aggressive-cloaking band reaching $5.3T - $12.6T, and a specialized-rate compounding ceiling at $37.9T. Weighted by the source-anchored probability distribution below the cohort chart (which places mass on the cloaking-honest bands because the founding families invented the apparatus rather than adopting it), the central reading is $14.7T — roughly 53% of 2026 US GDP.

At the visible endpoint, the implied 1913 - 2026 realized real return is only 4.07% — below the long-run 6.7% standard-market real rate. At the cloaking-honest realistic mid, it is 5.60%; under aggressive-cloaking assumptions, 6.86%; at the specialized ceiling, 8.23%. Weighted by a source-anchored probability distribution that accounts for the founding families' role as architects (not adopters) of holding companies, private foundations, family offices, and dynasty trusts, the expected wealth is $14.7T — implying a 1913 - 2026 realized real rate of roughly 7.33% , modestly above market. The apparent underperformance in the visible record is an artifact of measuring only the visible portion.

On the West Coast specifically: the genuine Gilded-Age Western cluster is not centered on Beverly Hills (a post-1920 enclave) but on the SF Bay Big-Four-railroad and Comstock-silver lineages (Crocker, Stanford / Huntington remnants, Hearst SF roots, Spreckels, Mackay, Flood, Fair), plus the LA-area Doheny / Chandler-Otis families and the San Marino / Pasadena corridor that Henry E. Huntington effectively built. The seasonal-compound geography (Pebble Beach 1919, Sun Valley 1936, Montecito since the 1900s) was itself a Gilded-Age development. With the Comstock fortunes added to the root list and Pebble Beach / Montecito added to the transport map, the West Coast represents roughly 11-14% of the modeled class, anchored by the Pacific-Union Club, Burlingame Country Club, California Club, and Bohemian Club.

methodology

Five-step bottom-up pipeline

  1. 01

    Build the root list

    Enumerate Gilded Age families whose peak fortune exceeded roughly 0.05% of US GDP at the time, or who held controlling stakes in strategic industries (rail, steel, oil, banking, real estate). Record founder cohort, surviving children, branches by ~1920, and institutional legacy.

  2. 02

    Project descendants by generation

    For each family, run a Monte Carlo over six generations (1870 - 2050 cohorts) using empirically grounded fertility means and per-generation extinction draws. Family-specific extinction risk biases the per-step Bernoulli.

  3. 03

    Overlay marriage alliances

    Estimate intra-elite marriage rates per generation, accumulate cross-family edges, then deduplicate descendants whose two parents both trace to the root list. The resulting graph yields a cluster count and a hub-share metric.

  4. 04

    Classify into control tiers

    Split living descendants into core controllers (board chairs, principal trustees, family-office principals), peripheral inheritors (substantial trust beneficiaries / foundation board members), and symbolic heirs.

  5. 05

    Apply cloaking expansion

    Add married-in spouses and the extended in-law and named-beneficiary network that aggregates into trusts, foundations, family offices, and holding LLCs. Report a separate count of beneficial owners obscured behind those vehicles.

scenario ranges

Conservative, central, and expansive parameter sets

Parameters that drive the spread: average completed children per couple per generation, per-generation lineage extinction probability, intra-elite marriage rate, per-tier core controller seats, peripheral share of remaining descendants, spouse multiplier, and cloaking factor.

indicator conservative central expansive
Surviving root lineages (of 55) 63 67 71
Living blood descendants (raw sum) 824 1,452 2,181
Unique blood descendants (after merger dedup) 707 1,217 1,769
Class incl. spouses 1,095 2,069 3,272
Class incl. cloaking (explicit roots only) 1,399 2,601 4,108
Synthetic long-tail descendants (incl. spouses) 1,488 4,420 12,210
In-law network extension added 458 2,672 12,804
Lost-surname maternal-line extension added 104 420 896
EXPANDED CLASS TOTAL (long-tail + in-laws + lost surnames) 3,449 10,113 30,018
Core controllers (institutional role count) 39 67 98
Peripheral inheritors 222 573 1,120
Symbolic heirs 622 1,121 1,642
Estimated dynastic clusters 17 13 10
Intra-elite marriage edges (model total) 127 179 247

conservative

fertility (gen 1-6)
3.5, 2.6, 2.1, 1.8, 1.7, 0.8
extinction
0.10, 0.15, 0.16, 0.14, 0.13, 0.05
intra-elite marriage
0.50, 0.40, 0.25, 0.15, 0.10, 0.08
core controllers per family per gen (T1 / T2 / T3)
4 / 2.5 / 1.5
peripheral share
30%
spouse multiplier
0.55
cloaking factor
8
in-law multiplier
0.5
lost-surname multiplier
1.2
synthetic long-tail (count · descendants/fam)
80 · 12

central

fertility (gen 1-6)
4, 3, 2.5, 2, 1.9, 1
extinction
0.08, 0.10, 0.12, 0.10, 0.09, 0.04
intra-elite marriage
0.55, 0.42, 0.28, 0.18, 0.12, 0.10
core controllers per family per gen (T1 / T2 / T3)
6 / 3.5 / 2
peripheral share
45%
spouse multiplier
0.7
cloaking factor
14
in-law multiplier
1
lost-surname multiplier
1.6
synthetic long-tail (count · descendants/fam)
130 · 20

expansive

fertility (gen 1-6)
4.5, 3.3, 2.8, 2.2, 2.1, 1.2
extinction
0.06, 0.07, 0.09, 0.08, 0.07, 0.03
intra-elite marriage
0.60, 0.45, 0.32, 0.22, 0.16, 0.12
core controllers per family per gen (T1 / T2 / T3)
8 / 5 / 3
peripheral share
60%
spouse multiplier
0.85
cloaking factor
22
in-law multiplier
1.8
lost-surname multiplier
2.2
synthetic long-tail (count · descendants/fam)
220 · 30

expanded class composition

Three reasons the original count was too restrictive

The first-pass model counted only blood descendants of the explicit root list plus their immediate spouses plus a small extended-trust adjustment. That misses three structurally large groups. Adding them roughly 2.5x to 7.3x the original headcount.

Long-tail regional dynasties

+4,420 central

The explicit root list captures the top 76 of an estimated 200-400 Gilded Age US families with peak fortunes above 0.02% of contemporaneous GDP. Beyond named additions like Cone, Cannon, Singer, Sage, Spreckels, Tiffany, Anheuser-Busch, Pew, Hershey, Wanamaker, and Dorrance, the model adds a synthetic remainder of 130 unnamed regional dynasties parameterized at 20 living descendants each.

Maternal-line descendants who lost the surname

+420 central

Genealogical reconstruction over-weights paternal-line surnames. Daughters who married out and whose grandchildren no longer carry the family name often retain trust beneficiary status, foundation board nominations, and family-office service relationships. The lost-surname multiplier of 1.6x applied to the symbolic tier accounts for this maternal-line opacity.

Extended in-law network

+2,672 central

When a descendant marries a non-elite spouse, the spouse's parents and siblings often gain class-adjacent access: foundation board nominations, family-office wealth services, social introductions, philanthropic networks. The in-law multiplier of 1x applied per married-in spouse counts these extended-kin orbits.

2,601 original class (explicit roots only)
10,113 expanded class (central)
3.89x multiplier

collective wealth

Standard rate vs. specialized rate (113-year compounding counterfactual)

Sum of peakNetWorthShareOfGdp across the explicit root list equals 20.7% of contemporaneous (1913) US GDP. Anchoring on US nominal 1913 GDP of $40B and applying a 40% founder-cohort philanthropy haircut yields ~$5B of effective starting capital that entered the compounding bath in 1913. The counterfactual compares passive standard market returns against a specialized PE / family-office vintage premium over 113 years, with a 55% lifetime leakage applied (estate tax, divorce, dispersion, scandal, bad investment, consumption).

regime real rate ceiling (no leak) realistic (after leakage)
CPI-only baseline (no real return) 0.0% $0.3T
Standard rate · broad equity total return 6.7% $7.6T $3.4T
Specialized rate · PE / family-office vintage premium 9.0% $84.2T $37.9T
Specialized premium · differential $34.5T

Holdings band (2026 USD) and corresponding implied realized real rate

band holdings (2026 USD) share of US GDP
Documented identifiable (visible registries only) $0.3T - $0.6T 1.6%
Plausibly cloaked (bottom-up estimate) $1.0T - $2.8T 6.8%
Documented + cloaked-realistic (combined) $1.3T - $3.4T 8.4%
Aggressive-cloaking assumption (3-5x bottom-up) $5.0T - $12.0T 32.0%
Specialized-rate compounding ceiling (this scenario) $37.9T 135%
Probability-weighted expected value (central reading) $14.7T 52.7%
Geometric midpoint of the range endpoints (low ↔ ceiling) $7.0T 25.1%

Implied 1913 - 2026 annualized real return at each endpoint

endpoint implied real rate vs. 6.7% standard-market
Documented only 4.07% -2.63 pp
Documented + cloaked-realistic mid 5.60% -1.10 pp
Aggressive-cloaking mid 6.86% +0.16 pp
At the specialized-rate ceiling 8.23% +1.53 pp

Visible-only is the wrong endpoint.

Using documented holdings of $0.3T - $0.6T implies a 1913-2026 realized rate of only 4.07% — below the standard market rate of 6.7%. But the article's own cloaking taxonomy says dynasty trusts, family offices, foundations, LP positions, and LLC chains are designed precisely to keep wealth out of those registries. Treating the visible portion as the truth is internally inconsistent with the rest of the model.

Cloaking-honest, the class modestly beat the market.

Adding a defensible bottom-up cloaking estimate of $1.0T - $2.8T brings the total to $1.3T - $3.4T (realistic combined). The implied 1913 - 2026 realized rate at the probability-weighted expected value of $14.7T is roughly 7.33% — modestly above the 6.7% standard market rate. Under aggressive cloaking the rate rises to 6.86%; at the specialized ceiling, 8.23%. The "structural underperformance" reading was a measurement artifact of looking only at visible registries.

Share of GDP today plausibly exceeds Forbes 400.

At the realistic combined endpoint, the class controls roughly 8% of 2026 US GDP. Under aggressive cloaking, ~ 32%. The probability-weighted expected value is $14.7T53% of US GDP — comfortably above the entire Forbes 400 (~19%), roughly comparable to the top 0.001% visible tier (~29%), and approaching the top 0.01% (~57%). The class did not lose its position; it engineered the appearance of having lost it.

cohort wealth comparison

Probability-weighted Gilded-Age class wealth vs. cohorts of similar size

The Gilded-Age class is plotted as a probability distribution across the five wealth bands. Each bucket carries explicit source anchors (table below the chart). The mass shifts toward the aggressive-cloaking and mid-to-ceiling bands because the founding families did not adopt private-equity / family-office vehicles — they invented their historical antecedents: Standard Oil Trust (1882, first holding company), Russell Sage Foundation (1907, first US private foundation), Bessemer Trust (1907, first formal family office), the Du Pont corporate trust, and Andrew Mellon's regime design as US Treasury Secretary 1921-1932. Multi-generational proto-PE expertise plus 113 years of compounding plus political influence on the tax / regulatory environment makes the visible-only and bottom-up endpoints structurally implausible as centers. Probabilities sum to 100%. Comparison cohorts are the Fed DFA top-end household tiers and the Forbes 400 at their documented aggregate wealth.

Wealth-cohort comparison with probability-weighted Gilded-Age band Logarithmic vertical axis from $0.3T to $50T. Four benchmark cohorts (Forbes 400, top 0.001%, top 0.01%, top 0.1%) plotted at their documented aggregate wealth. The Gilded-Age class column shows a probability distribution across five wealth bands, with the expected value marked. $0.3T $1T $3T $10T $30T $50T aggregate wealth (USD, log scale) 10% US GDP 25% US GDP 50% US GDP 100% US GDP $5.4T 19% GDP Forbes 400 ~400 individuals $8T 29% GDP Top 0.001% ~1,300 individuals $16T 57% GDP Top 0.01% ~13,000 households $22T 79% GDP Top 0.1% ~130,000 households 4% · $0.45T 22% · $2.35T 30% · $8.50T 28% · $20.0T 16% · $37.9T E[wealth] = $14.7T (53% US GDP) Gilded-Age class ~10,113 individuals
Logarithmic y-axis. Benchmark cohorts at documented aggregate wealth (Fed DFA household-wealth distribution + Forbes 400). The Gilded-Age class is shown as a probability distribution across five wealth bands, with stripe opacity proportional to mass and a horizontal marker at the expected value $14.7T (53% of 2026 US GDP). For a comparable-size cohort (~10K vs. top 0.01% at 13K), the class's expected aggregate wealth is in the same order of magnitude as the top 0.01% household tier; the realistic + cloaked-aggressive bands together hold 65% of the probability mass.

Source anchors per probability bucket

documented only $0.45T · 4%

Anchored on visible registries. Carries low probability because the article's own cloaking taxonomy describes the very vehicles designed to keep wealth out of these registries. Taking documented holdings as the truth contradicts the rest of the model.

  • Federal Reserve DFA (top-end household wealth)
  • IRS Form 990-PF foundation aggregates (~$1.4T US, of which ~$80-150B is Gilded-Age-tied)
  • SEC EDGAR Schedule 13D/G beneficial-ownership filings (5% threshold)
  • Forbes 400 disclosed net-worth methodology
realistic combined mid $2.35T · 22%

Documented + a defensible bottom-up estimate of cloaked holdings (single-family offices, dynasty trusts, LP positions, LLC chains, donor-advised funds). Treated as a probable floor rather than a center, because bottom-up reconstruction inherently misses what the apparatus is designed to hide.

  • Campden Wealth / UBS Global Family Office Report (US SFO AUM ~$5T)
  • Saez & Zucman (2014) "Wealth Inequality in the United States Since 1913"
  • ProPublica "Secret IRS Files" (2021) — confirmed beneficial-ownership opacity
  • IRS Statistics of Income: fiduciary returns (visible trust corpora)
aggressive cloaking mid $8.5T · 30%

If hidden vehicles aggregate to 3-5× the bottom-up estimate (i.e., the apparatus is more total than reconstructable). Matches independent SCF / Forbes / Zucman cross-comparison estimates that top-end wealth surveys undercount by 25-50%.

  • Zucman (2014) "Hidden Wealth of Nations" — global offshore ~$7.6T (US-owned ~$1.4-3T)
  • Saez & Zucman (2020) "Trends in US Income and Wealth Inequality" (SCF undercounting analysis)
  • Hines Jr. (2010) tax-haven vehicle estimates
  • Tax Justice Network Financial Secrecy Index — opacity scoring of US trust-friendly states
mid-to-ceiling $20T · 28%

Implied if dynastic-trust opacity is near-total AND the class captured significant excess returns through proto-PE vehicles that they themselves originated. Bessemer Trust (Phipps, 1907) has approximated ~9% real returns over 100+ years on disclosed segments — a documented case of sustained specialized-rate compounding at the family-office level.

  • Standard Oil Trust (1882) — first holding company; Standard Oil dissolution 1911 distributed pieces back to insiders
  • Bessemer Trust founding (1907) and disclosed long-run track record
  • Yale endowment "Swensen model" derived from family-office allocation strategies
  • Cambridge Associates US PE Index — top-quartile 12-14% IRR with vintage selection
at specialized ceiling $37.9T · 16%

The 113-year compounded ceiling at 9% real with 55% leakage. Carries non-trivial weight because the founding families ARE the historical reference cases for sustained family-office compounding (Mellon, du Pont, Rockefeller arms, Phipps via Bessemer, Pritzker offshoots). Capped at 16% because aggregate-class realization (vs. individual-family) is constrained by extinction, dispersion, philanthropy, and political tax shocks (estate-tax peaks 1916, 1941, 1976).

  • Cambridge Associates PE benchmark (top-quartile sustained returns)
  • Berkshire Hathaway 60-year record (~9-10% real) as analog ceiling
  • Andrew Mellon Treasury secretaryship 1921-1932 (tax regime design)
  • South Dakota Trust Co reports — perpetual dynasty-trust corpora >$100B aggregate

The plausibility case

For a 10,113-person cohort, the expected aggregate wealth is $14.7T (53% of 2026 US GDP) — above Forbes 400 ($5.4T, 400 individuals), above the top 0.001% ($8T, 1,300 households), and approaching the top 0.01% ($16T, 13,000 households). The class meaningfully overlaps with all three benchmark cohorts at the individual level, so these are not disjoint totals; the class is a structurally invisible component of the visible top-end.

Per-capita density

Expected per-capita wealth is roughly $1M per class member. That sits between the top 0.001% (~$6.2B per household at 1,300) and the top 0.01% (~$1.2B per household at 13K) — i.e. the class as a whole has density comparable to the top 0.001%-to-0.01% range. The Forbes 400 remains the densest visible cohort (~$13.5B per individual), but Forbes 400 individuals are also disproportionately class members.

Where the uncertainty lives

58% of the probability mass sits in the aggressive-cloaking and mid-to-ceiling bands ($8.5T - $20T centers). 16% sits at the specialized ceiling. Only 26% of mass sits below the realistic-combined-mid band. The distribution reflects two compounding facts: the cloaking apparatus is documented to exist, and the founding families invented the apparatus rather than adopting it.

generational pyramid

Projected descendants by generation (central scenario)

Generational pyramid of descendants Horizontal bars showing total projected descendants per generation, with the living-today share highlighted. Gen 1 · born 1870-1900 total 362 · living 0 Gen 2 · born 1900-1930 total 500 · living 0 Gen 3 · born 1930-1960 total 565 · living 396 Gen 4 · born 1960-1990 total 519 · living 493 Gen 5 · born 1990-2020 total 457 · living 452 Gen 6 · born 2020-2050 (partial) total 223 · living 111
Dark band: total cumulative descendants ever born in that generation across all 76 root families (central scenario, before marriage-merger dedup). Highlighted overlay: share still alive in 2026 based on cohort age. Generations 1 and 2 are demographically complete and shown for context only.

class composition

Core controllers, peripheral inheritors, symbolic heirs

Class composition by scenario Three stacked bars (one per scenario) showing the split between core controllers, peripheral inheritors, and symbolic heirs. conservative 884 adult descendants central 1,761 adult descendants expansive 2,860 adult descendants core controllers peripheral inheritors symbolic heirs

root families

76 families · 6 tier-1, 24 tier-2, 46 tier-3

Tier 1: peak fortune ≥ 0.6% of contemporaneous US GDP. Tier 2: 0.2% - 0.6%. Tier 3: < 0.2%. Top 12 by central-scenario living-descendant count shown below; full 76-family list is the source of truth in src/data/elite-class/root-families.ts.

01

Singer

machinery · NYC · founded ~1870s

T3
peak share of US GDP
0.12%
founder children · branches by 1920
24 · 8
living descendants (central)
~104 (p10-p90: 65 - 144)
core controllers (central)
~4.8
institutional legacy
Singer Building (former) · Princesse de Polignac line (France)

Isaac Singer fathered 24 children with multiple partners; massive descendant network including European aristocratic branches.

02

Vanderbilt

shipping · NYC · founded ~1860s

T1
peak share of US GDP
1.15%
founder children · branches by 1920
13 · 8
living descendants (central)
~50 (p10-p90: 27 - 80)
core controllers (central)
~2.3
institutional legacy
Vanderbilt University · Biltmore Estate (extant private) · NY Central legacy assets

Fortune diluted across many branches in 2-3 gens; bloodline survives, name capital largely cultural.

03

Swift

food · Chicago · founded ~1890s

T3
peak share of US GDP
0.15%
founder children · branches by 1920
11 · 7
living descendants (central)
~45 (p10-p90: 20 - 73)
core controllers (central)
~2.1
institutional legacy
Swift & Co. (later JBS/Sara Lee) · Multiple smaller family foundations

Eleven children produced unusually large descendant pool for the tier.

04

Hill (James J.)

rail · Twin Cities · founded ~1890s

T2
peak share of US GDP
0.35%
founder children · branches by 1920
10 · 7
living descendants (central)
~43 (p10-p90: 20 - 70)
core controllers (central)
~2.0
institutional legacy
Northwest Area Foundation · Great Northern legacy

Twin Cities anchor; large branch count; substantial Minnesota institutional footprint.

05

Cannon

machinery · Atlanta · founded ~1890s

T3
peak share of US GDP
0.05%
founder children · branches by 1920
9 · 5
living descendants (central)
~38 (p10-p90: 15 - 63)
core controllers (central)
~1.7
institutional legacy
Cannon Mills legacy · Kannapolis NC namesake

NC textiles, sister fortune to Cone; multi-generational regional anchor.

06

Lazard

banking · NYC · founded ~1880s

T3
peak share of US GDP
0.08%
founder children · branches by 1920
9 · 5
living descendants (central)
~37 (p10-p90: 14 - 65)
core controllers (central)
~1.7
institutional legacy
Lazard Freres (now public) · David-Weill collection

Lazard brothers + David-Weill family; transatlantic banking; large descendant network.

07

Lehman

banking · NYC · founded ~1880s

T2
peak share of US GDP
0.20%
founder children · branches by 1920
8 · 6
living descendants (central)
~35 (p10-p90: 13 - 60)
core controllers (central)
~1.6
institutional legacy
Lehman Brothers (defunct 2008) · Lehman College · Robert Lehman Foundation

Bank failed 2008; family separate from bank since 1980s; descendants extensive.

08

Goldman / Sachs

banking · NYC · founded ~1880s

T3
peak share of US GDP
0.10%
founder children · branches by 1920
8 · 5
living descendants (central)
~32 (p10-p90: 11 - 58)
core controllers (central)
~1.5
institutional legacy
Goldman Sachs (now public, family no longer controls) · Sachs family philanthropies

Goldman-Sachs intermarriage; bank long since partnership-then-public; descendants extensive.

09

Astor

real-estate · NYC · founded ~1840s

T1
peak share of US GDP
0.95%
founder children · branches by 1920
8 · 5
living descendants (central)
~32 (p10-p90: 9 - 55)
core controllers (central)
~1.5
institutional legacy
Astor Foundation · British Astor peerage line · NYPL endowment

Splits into US and UK (peerage) branches by 1900; both lines extant.

10

Cone

machinery · Atlanta · founded ~1890s

T3
peak share of US GDP
0.06%
founder children · branches by 1920
7 · 4
living descendants (central)
~30 (p10-p90: 10 - 55)
core controllers (central)
~1.4
institutional legacy
Cone Mills legacy · Cone Health (NC) · Cone Collection (Baltimore Museum of Art)

North Carolina textiles; sisters Etta and Claribel donated major Matisse/Picasso collection.

11

Seligman

banking · NYC · founded ~1880s

T3
peak share of US GDP
0.15%
founder children · branches by 1920
8 · 5
living descendants (central)
~30 (p10-p90: 8 - 54)
core controllers (central)
~1.4
institutional legacy
J. & W. Seligman & Co. legacy · Various NYC philanthropies

Eight brothers; international banking; declined relative to peers after WWI.

12

du Pont

chemicals · Wilmington · founded ~1820s

T1
peak share of US GDP
0.90%
founder children · branches by 1920
7 · 10
living descendants (central)
~30 (p10-p90: 9 - 54)
core controllers (central)
~1.4
institutional legacy
DuPont Co. (later split DowDuPont/Chemours/Corteva) · Longwood Foundation · Welfare Foundation

Largest documented surviving descendant pool of any US Gilded-Age family (estimated 3-4k cousins).

sector composition

Industries of origin (root list, 76 families)

banking 15
food 12
real-estate 6
machinery 6
finance-merchant 5
rail 5
oil 4
steel 4
media 4
retail 4
mining 4
tobacco 3
shipping 2
chemicals 1
utilities 1

alliance network

Marriage-merger graph metrics

13 distinct dynastic clusters (central)

Approximate connected-component count after accumulating intra-elite marriage edges across all generations. Ranges from 10 (expansive — more consolidation) to 17 (conservative — fewer cross-family ties survive).

179 elite-elite marriage edges (model total)

Cross-family marriage edges accumulated across six generations. Each edge represents a couple in which both spouses descend from different root families on the list.

20% edges incident on the top 10% of families

Tier-1 fortunes attract a disproportionate share of cross-family marriages. Rockefeller, Vanderbilt, Astor, du Pont and Carnegie sit at the densest end of the network even though the Carnegie blood line is thin.

0.84 descendant deduplication factor

Multiplier applied to the raw cross-family sum to avoid double-counting individuals who descend from two root families simultaneously. Lower factor = more historical consolidation.

asset cloaking mechanisms

How 1,064 beneficial interests sit behind a handful of visible entities

Each row catalogs a legal or financial vehicle that separates legal title from effective control. The "beneficiaries per vehicle" column is the empirical range across better-documented case studies (IRS Form 990-PF for foundations, Schedule 13D filings for public-equity positions, deed records for real-estate chains, family-office directories for managed-account counts).

Dynasty trust

5 - 50 beneficiaries / vehicle

Holds family assets across generations with limited public disclosure; trustee is the legal owner.

separates title from controlhigh
obscures beneficial ownerhigh
tax advantagehigh

GST-exempt trusts sitused in SD, NV, DE, or AK with perpetual or 360-year horizons.

Single-family office

5 - 30 beneficiaries / vehicle

Manages investments, real estate, philanthropy, and personnel for one extended family.

separates title from controlmedium
obscures beneficial ownerhigh
tax advantagemedium

Bessemer Trust (originally Phipps), Rockefeller & Co (now public), Pitcairn Trust.

Multi-family office

20 - 200 beneficiaries / vehicle

Bundles services for multiple lineages, aggregating allocation and obscuring individual stakes.

separates title from controlmedium
obscures beneficial ownerhigh
tax advantagemedium

BBR Partners, Brown Brothers Harriman, Lombard International.

Private foundation

3 - 15 beneficiaries / vehicle

Holds and grants capital under 501(c)(3); family controls board and grantmaking.

separates title from controlhigh
obscures beneficial ownermedium
tax advantagehigh

Mellon, Rockefeller, Duke, Kellogg, Heinz Endowments.

Donor-advised fund

1 - 5 beneficiaries / vehicle

Donor controls grant flow without operating a foundation; sponsor holds legal title.

separates title from controlhigh
obscures beneficial ownerhigh
tax advantagehigh

Fidelity Charitable, Schwab Charitable, Vanguard Charitable accounts.

Private equity / hedge fund GP

10 - 100 beneficiaries / vehicle

Family capital allocated through GP entities; LP positions hide individual contributors.

separates title from controlmedium
obscures beneficial ownerhigh
tax advantagehigh

Pritzker family's Marmon, Walton Enterprises, family-anchored funds-of-funds.

Real-estate holding chain

1 - 10 beneficiaries / vehicle

LLCs nested in LLCs hold land and buildings; beneficial owner rarely in public record.

separates title from controlhigh
obscures beneficial ownerhigh
tax advantagemedium

NYC, Aspen, Palm Beach, Hamptons titleholders organized as DE / NV / WY LLCs.

Charitable lead / remainder trust

2 - 8 beneficiaries / vehicle

Splits income and remainder interest between family and charity; reduces estate tax.

separates title from controlmedium
obscures beneficial ownermedium
tax advantagehigh

CRUTs, CLATs commonly used to transfer concentrated stock at low gift-tax cost.

geographic dispersion

Primary hubs and enclaves

New York metro

32% of modeled class

Upper East Side · Greenwich CT · Bedford NY · Hamptons · Tuxedo Park · Oyster Bay

Highest density of Gilded Age root families and surviving family offices.

Boston / North Shore

9% of modeled class

Beacon Hill · Brookline · Manchester-by-the-Sea · Naushon Island · Pride's Crossing

Brahmin lineages: Cabot, Lowell, Forbes, Saltonstall, Higginson.

Philadelphia / Main Line

5% of modeled class

Bryn Mawr · Gladwyne · Villanova · Chestnut Hill

Old Quaker and Pew-adjacent wealth; quieter institutional footprint.

Pittsburgh / Wilmington corridor

7% of modeled class

Sewickley · Fox Chapel · Wilmington Greenville · Chateau Country

Carnegie / Mellon / Frick / Phipps / Heinz / du Pont anchor.

Chicago / North Shore

8% of modeled class

Lake Forest · Winnetka · Kenilworth · Glencoe · Gold Coast

McCormick, Field, Armour, Swift, Pillsbury legacies extend into MN.

San Francisco / Peninsula

6% of modeled class

Pacific Heights · Atherton · Hillsborough · Woodside · Pebble Beach

Big Four railroad descendants plus modern-era overlap.

Los Angeles / South Coast

5% of modeled class

San Marino · Hancock Park · Bel Air · Pacific Palisades · Montecito

Huntington / Doheny lineage anchors; broad later overlay from migrating wealth.

South Florida

7% of modeled class

Palm Beach · Manalapan · Jupiter Island · Hobe Sound

Winter enclaves built by Flagler-era development; high overlap with NY metro families.

Mountain West retreats

4% of modeled class

Aspen CO · Jackson Hole WY · Sun Valley ID · Big Sky MT

Secondary residences; high concentration of family-office LP capital.

Carolinas Piedmont / Triangle

4% of modeled class

Winston-Salem · Pinehurst · Camden SC

Duke / Reynolds / Cone / Cannon families; some Hampton/Long Island migration.

International outposts

8% of modeled class

London (Mayfair / Belgravia) · Paris · Geneva · Monaco · Sydney (smaller)

Astor UK peerage branch + Warburg + portion of Pritzker / Mellon expat lines.

Other / dispersed

5% of modeled class

College towns, small-city civic anchors, second-generation diaspora

Long tail of descendants no longer in primary enclaves.

probable zones · transport economy

Spatial footprint and the private-aviation, yacht, and helicopter circuit

Mapping the class onto its physical footprint: 16 private-aviation airfields, 7 urban primary clusters, 6 estate-zone corridors, 14 seasonal compounds, 3 large-landholding ranches, and 11 international outposts, joined by 14 dominant migration corridors. Aggregate annual class-tied private-aviation movements across the top airfields ≈ 255,950; the listed corridors account for ~70,800 class trips/year.

OpenStreetMap base map with CARTO Dark Matter styling. Marker size for airfields scales with class-tied movements per year; corridor stroke width scales with annual class trips on that corridor. Hover or tap any marker / line for detail. Scroll to zoom · drag to pan · pinch on touch.
urban primary residence 7 nodes
estate-zone corridor 6 nodes
seasonal compound 14 nodes
private-aviation airfield 16 nodes
international outpost 11 nodes
ranch / large landholding 3 nodes

Top private-aviation airfields by class movements

Class-tied movements ≈ (FBO annual GA movements) × (estimated class share). Teterboro tops the list because it is the default departure point for Manhattan-based class members regardless of destination.

airfield total GA mvmts/yr class share class mvmts/yr
Teterboro (TEB) 175,000 18% 31,500
Westchester County (HPN) 140,000 20% 28,000
Palm Beach Intl (PBI) 175,000 15% 26,250
Bozeman (BZN) 140,000 18% 25,200
Bedford / Hanscom MA (BED) 130,000 15% 19,500
Naples (APF) 95,000 20% 19,000
Nantucket Memorial (ACK) 55,000 30% 16,500
East Hampton (HTO) 30,000 45% 13,500
Santa Barbara (SBA) 75,000 18% 13,500
Jackson Hole (JAC) 65,000 20% 13,000

Dominant migration corridors (annual class trips)

Estimated class-tied trips per year on each major route. NYC ↔ Hamptons in summer and NYC ↔ Palm Beach in winter are the densest single corridors in the dataset.

corridor season trips / yr
NYC ↔ East Hampton summer 18,000
NYC ↔ Palm Beach winter 14,000
NYC ↔ Nantucket / Vineyard summer 9,000
NYC ↔ Aspen winter 4,500
SF ↔ Pebble Beach year-round 4,000
NYC ↔ London year-round 3,200
LA ↔ Aspen winter 3,000
NYC ↔ Caribbean (Mustique / Lyford / Anguilla) winter 2,800
Boston ↔ Bar Harbor summer 2,500
London ↔ Mediterranean (Sardinia / Cap Ferrat / Mykonos) summer 2,400
NYC ↔ Montecito / Santa Barbara winter 2,200
NYC ↔ Newport summer 2,000
SF ↔ Sun Valley year-round 2,000
London ↔ St. Moritz (via Engadine / Samedan) winter 1,200

aggregate

Annual transport-economy spend

$10.9B total annual class transport economy
$4.7B private aviation · 260,000 flights / yr · avg $18B / flight
$3.3B yacht operations · 1,300 class-tied vessels >100 ft · avg $2.5M opex /yr
$0.55B helicopter / BLADE class share · 110,000 flights / yr
$2.4B concierge / EP security / dedicated driver and household transport staff

Implied per-class-member transport spend (central): ~$ 1078K / year averaged across the 10,113-person expanded class. The actual distribution is sharply skewed toward the ~640 core controllers and peripheral inheritors who do the bulk of private-aviation and yacht movement; symbolic heirs and synthetic long-tail members are below the median.

institutional footprint

Where 67 surviving lineages remain overrepresented

Ivy + peer universities (boards, endowed chairs, named buildings)

Harvard · Yale · Princeton · Columbia · MIT · Stanford · Chicago · Penn

Trustee rolls and named-gift dockets show clear concentration of root-family surnames across multiple generations of board service.

Major private banks and family offices

Brown Brothers Harriman · Bessemer Trust · Pitcairn Trust · Glenmede · Pacific Family Office

Several survive as direct lineal institutions; board / partnership rolls remain partially family-staffed.

Cultural institutions (museums, libraries, orchestras)

MoMA · Whitney · Frick Collection · Morgan Library · Field Museum · Carnegie Hall · BSO

Founding-family seats on governance boards remain common 100+ years after the original endowment gift.

Conservation / land-trust governance

Open Space Institute · The Nature Conservancy · National Audubon Society · Land Trust Alliance

Old real-estate families frequently appear; private-estate land donations often have governance carve-outs.

National foundations (asset-weighted)

Rockefeller · Mellon · Duke Endowment · W.K. Kellogg · Pew · Hewlett · Packard

Several largest by AUM trace directly to Gilded Age fortunes; board composition partially family-tied.

Think tanks and policy NGOs

Council on Foreign Relations · Brookings · AEI · Aspen Institute · Conference Board

Board memberships overlap with major family offices and asset managers connected to root families.

White-shoe law firms

Cravath · Sullivan & Cromwell · Davis Polk · Simpson Thacher · Cleary Gottlieb

Trust, estate, and family-office work concentrates root-family legal needs in a small number of firms.

Boarding schools (governance and admissions pipelines)

Groton · St. Paul's · Choate · Andover · Exeter · Hotchkiss · Lawrenceville

Multi-generational family enrollment patterns; trustee rolls overlap with university and bank boards.

cohort positioning

Where the class actually sits in clubs, universities, and businesses

Mapping the 10,113-person expanded class onto identifiable institutional seats. The footprint is concentrated: roughly 1,098 governance positions (university trustees + boarding-school trustees + corporate / foundation / cultural board seats) and 12,325 class-tied memberships across 30 founder-tier private clubs, with substantial overlap (a single class member typically holds 2-4 club memberships). Annual cohort flow into the institutional system is ~704 new positions and admissions per year.

12,325 class-tied club memberships across 30 founder-tier clubs
57 university trustee / corporation seats (12 institutions)
205 traceable legacy admissions per year (Ivy + Stanford + peers)
149 senior society / final club / eating club taps per year
1,403 boarding school enrollment from class families (10 schools)
985 corporate / foundation / financial governance seats

Private clubs (founder-tier)

30 clubs across 11 metros. Class-share = estimated fraction of total members traceable to the modeled class. Aggregate class-tied seats = 12,325.

club metro founded members class share class seats
Knickerbocker Club NYC 1871 1,000 45% 450
Union Club of the City of New York NYC 1836 1,500 35% 525
Metropolitan Club NYC 1891 1,800 30% 540
The Brook NYC 1903 500 50% 250
Racquet and Tennis Club NYC 1890 1,700 30% 510
The Links Club NYC 1916 1,100 35% 385
River Club of New York NYC 1931 750 35% 263
Century Association NYC 1847 2,300 20% 460
New York Yacht Club NYC 1844 3,000 20% 600
Somerset Club Boston 1851 1,000 50% 500
Union Club of Boston Boston 1863 1,400 35% 490
The Country Club Boston 1882 1,300 45% 585
Tavern Club Boston 1884 700 30% 210
Philadelphia Club Philadelphia 1834 800 50% 400
Rittenhouse Club Philadelphia 1875 500 30% 150
Chicago Club Chicago 1869 1,300 40% 520
Casino Club Chicago 1914 1,000 40% 400
Onwentsia Club Chicago 1895 700 45% 315
Pacific-Union Club San Francisco 1852 900 45% 405
Bohemian Club San Francisco 1872 2,700 20% 540
Burlingame Country Club San Francisco 1893 700 45% 315
California Club Los Angeles 1887 1,800 30% 540
Metropolitan Club (DC) Washington DC 1863 2,400 20% 480
Cosmos Club Washington DC 1878 3,300 15% 495
Bailey's Beach Club Newport 1897 450 60% 270
Reading Room Newport 1854 300 60% 180
Bath & Tennis Club Palm Beach 1926 1,200 45% 540
Everglades Club Palm Beach 1919 800 45% 360
Maidstone Club East Hampton 1891 950 45% 428
National Golf Links of America Southampton 1911 400 55% 220
Universities (governance + legacy admissions)

Aggregate ~57 class-tied trustee seats and ~205 traceable legacy admissions per year across 12 institutions. Total trustee board capacity = 446 seats; class share ≈ 13%.

university board size class trustees freshman class legacy admits / yr class legacy / yr
Harvard 13 3 1,700 250 25
Yale 17 4 1,550 230 30
Princeton 23 5 1,350 200 22
Columbia 24 4 1,500 180 18
Penn 35 6 2,400 380 25
Brown 42 5 1,700 220 18
Cornell 64 7 3,400 280 15
Dartmouth 26 4 1,150 200 15
Stanford 35 4 1,700 250 14
MIT 77 5 1,150 60 6
Chicago 53 5 1,800 90 8
Duke 37 5 1,750 220 9

Senior societies, final clubs, eating clubs (annual taps)

~149 traceable class taps per year across the old-line Yale senior societies, Harvard final clubs, and Princeton Bicker eating clubs. These are the highest per-seat concentration of class membership in the entire dataset (Bones / Porcellian / Ivy all ≥ 35% class share).

Yale

~25 class taps / yr
  • Skull and Bones 15 taps · 35% class share · est ~5 class / yr

    Founded by William Huntington Russell; canonical old-line society.

  • Scroll and Key 15 taps · 30% class share · est ~5 class / yr

    Sister "old line" society; financial / legal lineage slant.

  • Wolf's Head 15 taps · 25% class share · est ~4 class / yr

    Third "Big Three" Yale society.

  • Berzelius / Book and Snake / Manuscript / Elihu / St. Anthony 75 taps · 15% class share · est ~11 class / yr

    Aggregate of mid-tier senior societies; lower class density than the Big Three.

Harvard

~52 class taps / yr
  • Porcellian 12 taps · 45% class share · est ~5 class / yr

    Oldest final club; founder-tier admissions, multi-generational legacy.

  • A.D. Club 25 taps · 35% class share · est ~9 class / yr

    Old-line; FDR was a member.

  • Fly Club 30 taps · 30% class share · est ~9 class / yr

    JFK era; founder-tier identity.

  • Spee Club 25 taps · 25% class share · est ~6 class / yr

    JFK was tapped; Lowell legacy seat density.

  • Owl / Fox / Phoenix / Delphic / Bat 150 taps · 15% class share · est ~23 class / yr

    Aggregate of newer / lower-density final clubs.

Princeton

~72 class taps / yr
  • Ivy Club 60 taps · 35% class share · est ~21 class / yr

    Oldest and most selective Bicker club.

  • Cottage Club 70 taps · 30% class share · est ~21 class / yr

    F. Scott Fitzgerald era; founder-tier identity.

  • Tiger Inn 75 taps · 20% class share · est ~15 class / yr

    Bicker club; lower founder-density than Ivy/Cottage.

  • Cap and Gown 75 taps · 20% class share · est ~15 class / yr

    Bicker club; broader admissions.

Boarding school feeders

10 schools enrolling ~1,403 students from class families at any time (out of 6,990 total enrollment), plus ~56 class-tied trustee seats. Graduating class flow per year ≈ 351.

school founded enrollment class share class enrolled class trustees
Groton School 1884 400 30% 120 8
St. Paul's School 1856 540 25% 135 6
Choate Rosemary Hall 1896 870 20% 174 6
Phillips Academy Andover 1778 1,150 15% 173 5
Phillips Exeter Academy 1781 1,100 15% 165 4
Hotchkiss School 1891 600 25% 150 7
Lawrenceville School 1810 820 20% 164 6
Deerfield Academy 1797 660 20% 132 5
Middlesex School 1901 410 25% 103 5
Episcopal High School 1839 440 20% 88 4

Corporate, financial, and governance channels

Aggregate ~985 class-tied positions across six channels. The dynasty-controlled-firm and private-bank channels remain the densest per-seat concentrations; the Fortune 500 directorship pool is large in absolute terms but dilute (~4-5% of seats).

channel total positions class positions class share
Family-controlled voting trusts and dynasty-owned firms 60 35 58%
Surviving private family-office banks and trust companies 80 50 63%
Fortune 500 directorships 5,000 220 4%
Major US private-equity, hedge-fund, and asset-manager LP / GP seats 2,500 180 7%
National foundation trusteeships (asset-weighted top 50) 750 220 29%
Museum / orchestra / library governance (US top 30 by AUM) 1,000 280 28%

Family-controlled voting trusts and dynasty-owned firms

Surviving direct Gilded-Age governance: Hershey Trust (Hershey Co), Dorrance trust (Campbell), Mars-adjacent Wrigley, Cargill, du Pont via Chemours/Corteva, Reynolds family at Z. Smith Reynolds Foundation, Anheuser-Busch family holdings post-InBev.

Surviving private family-office banks and trust companies

Brown Brothers Harriman partners, Bessemer Trust (Phipps), Pitcairn Trust, Glenmede (Pew), Whittier Trust, Northern Trust private wealth.

Fortune 500 directorships

Roughly 4-5% of Fortune 500 director seats; concentration in finance, media, REITs, consumer staples, and family-anchored firms.

Major US private-equity, hedge-fund, and asset-manager LP / GP seats

Family offices anchor LP capital for Blackstone, Apollo, KKR, Carlyle; GP-side board interlocks more limited but present at smaller alternative managers.

National foundation trusteeships (asset-weighted top 50)

Rockefeller, Mellon, Duke Endowment, Pew, Kellogg, Carnegie Corp, Hewlett, Packard, Heinz Endowments, Z. Smith Reynolds, Hershey Trust.

Museum / orchestra / library governance (US top 30 by AUM)

Met / MoMA / Whitney / Frick / Morgan / Field / Carnegie Hall / BSO / Boston MFA / Huntington Library / National Gallery / Walters.

The funnel is narrow at the top and wide at the base.

At the top: ~12-15 "founder-tier" senior society / final club / elite city-club seats per year per institution, with class share of 35-50%. At the base: ~200 legacy admits per year across all peer universities, plus ~350 boarding school graduates per year from class families. The institutional reproduction system converts ~700 class admissions per year into the next generation of governance seat-holders.

Governance saturation is ~11% of the class.

~1,098 governance seats divided by ~10,113 expanded class members equals ~11% — i.e. about one in nine class members occupies a formal institutional position of power. The rest hold trust beneficiary interests, family-office service relationships, and social network access rather than direct seats.

Club density is a stronger signal than university trusteeship.

Founder-tier clubs (Knickerbocker, Philadelphia, Somerset, Brook, Bath & Tennis, Bailey's Beach) show 45-60% class share — the highest concentration of class membership in the entire dataset. University boards have shifted toward meritocratic / geographic / political balance since the 1970s; club admissions have not.

limitations

What the model does not, and cannot, do

  1. Not a census. The output is a modeled estimate driven by transparent assumptions, not a roster. Individuals are not named and the ranges should be treated as orders-of-magnitude calibration, not precise counts.
  2. Survivorship bias in the root list. Families whose fortunes were lost in the 1929 crash or the 1970s stagflation, or whose surnames did not produce searchable institutions, are under-represented. The 76-family list is the top of a long tail of regional dynasties whose descendants are not captured here.
  3. Fertility distribution uncertainty. The per-generation means used are central estimates from college-educated white US fertility tables, adjusted slightly down in the post-Gilded era to match documented elite class behavior. Real per-family variance is wide.
  4. Marriage-network simplification. The cluster count comes from an analytical sparse-graph formula, not a per-individual social-network simulation. A full pedigree simulation would produce a richer graph and likely fewer, denser clusters.
  5. Cloaking estimate is a lower bound. The beneficiaries-per-vehicle ranges come from publicly visible cases. The whole point of these vehicles is opacity — so the true count of beneficial owners behind any given trust, DAF or LLC chain may be higher than the documented range suggests.
  6. No deanonymization of living individuals. The model works at the family-aggregate level. The article does not attempt to identify specific living descendants beyond what is already public and well established.
  7. Cross-class boundary is fuzzy. Many modern wealth fortunes (tech, finance, hedge funds) overlap and intermarry with Gilded Age lines. The model deliberately does not extend into the post-1970 fortunes; the result is therefore a floor for "old-money-connected" headcount, not a ceiling for the broader US ultra-wealthy class.

what to read into the numbers

Three calibration points

  1. Order of magnitude. The full modeled class — blood descendants plus spouses plus extended trust-network beneficiaries — sits between roughly 1,399 and 4,108 people. Even at the high end, this is roughly 0.001% of the US population. It is a small class.
  2. Concentration matters more than headcount. The 13 estimated clusters in the central scenario each represent dense webs of intermarriage, shared family offices, joint-trustee arrangements, and overlapping foundation boards. The relevant unit of analysis is cluster, not individual.
  3. Cloaking compresses visibility. Roughly 1,064 beneficial interests are modeled as residing behind a small number of visible vehicles (trusts, foundations, family offices, LP positions, LLC chains). The headcount of the class is far larger than the headcount of legally identifiable beneficial owners in any public registry.

Sources and data spines

Model source: src/data/elite-class/model.ts and src/data/elite-class/root-families.ts. The simulation is deterministic via a seeded PRNG so the headline numbers in this article are reproducible at build time. Adjusting parameters in the scenario blocks regenerates every figure on this page.