policy tool — City of Los Angeles — 2026
the Los Angeles blight remediation pipeline
Los Angeles runs a fine-to-comply enforcement model that generates revenue but rarely resolves extreme blight. This pipeline identifies the cases where that model has already failed — parcels with years of persistent open violations and visual evidence of advanced distress — and generates structured disposition recommendations, from final compliance notice through eminent domain and a community-priority land sale cascade.
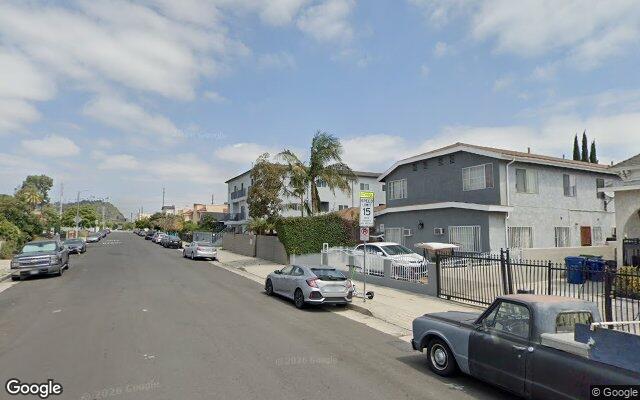
street view evidence
Four real parcels — extreme distress to invisible blight.
the failure mode
Fine-to-comply is a revenue mechanism, not a remediation mechanism.
When LA issues a code violation and the owner pays the fine without remedying the condition, the city collects revenue and the violation remains open. The cycle repeats — more notices, more fines, more open cases — while the property continues to deteriorate and the neighbors continue to absorb the externality. For properties whose owners are absent, insolvent, or indifferent, this process can continue indefinitely. The city's enforcement apparatus is not designed to resolve these cases; it is designed to document them.
The alternative — condemnation under California Health and Safety Code §17980, followed by demolition, site remediation, and sale — exists in law but is rarely triggered because the city lacks a systematic triage mechanism. There is no pipeline from "has persistent violations" to "eminent domain candidacy" that accounts for physical condition alongside the paper record.
This pipeline builds that triage mechanism. It cross-references the city's open-data violation record with current Street View imagery to score each candidate on a composite blight index, then assigns a disposition path proportional to the severity.
data stack
Five public data sources, one vision model, no auth walls.
CalEPA's census-tract burden index (0–100 percentile) combining pollution exposure and population vulnerability. The district-sweep mode queries tracts with CES score ≥ 75th percentile in LA County and draws a stratified random sample of parcels within each. The logic: environmental damage and structural blight are co-located failures. A parcel in a 99th-percentile CES tract with extreme visual distress is a compound externality — the neighborhood is already bearing concentrated environmental cost; unchecked structural blight compounds that injustice. Auth-free ESRI FeatureServer (CalEPA/OEHHA org).
The primary violation feed. Queried city-wide for all open cases older than 12 months. Grouped by address to surface multi-case parcels. Auth-free Socrata endpoint; optional API key improves rate limits. Typically returns 50,000–200,000 rows for a 12-month-open filter; client-side grouping produces the candidate parcel list.
Supplemental signal. For each candidate parcel, a 75m radius query pulls permit history to determine last_permit_year and 5-year investment activity. A Tier 1 candidate typically shows no permits since before 2015 — investment stagnation that correlates with, but is not equivalent to, physical distress.
Four images per parcel (N, E, S, W headings) fetched from the parcel centroid at 640×640px. Imagery is typically 1–3 years current. The pipeline checks whether the structure is visible in any of the four frames before scoring — if the building is not framed, the parcel is flagged for manual Street View verification via the deep link rather than scored.
Each set of four Street View images is passed to Claude with a blight-specific scoring prompt. The system prompt is cached across all calls, keeping per-parcel model cost under $0.006. The model scores five distress dimensions (0–10 each), classifies overall condition, and identifies primary visible indicators. Output is strict JSON — no post-processing or hallucination correction required in practice.
scoring rubric
Composite blight index — four inputs, each 0–10.
Visual distress carries the highest weight because violation records are lagging indicators — an owner can pay a fine without remedying the condition. Street View imagery is the leading indicator the paper trail misses.
Visual distress dimensions
Claude vision scores each of five dimensions on a 0–10 integer scale. The five scores are averaged to produce the visual component.
Unmanaged growth obscuring or penetrating the structure
Roof damage, broken openings, failing envelope
Junk, equipment, vehicle hulks stored on-site
Boarded openings, no habitation signs, security barriers
Missing material, tarps, collapse zones, vegetation intrusion
Tier thresholds
disposition cascade — tier 1 only
From eminent domain candidacy to open bid in four steps.
Tier 1 candidates enter a four-step disposition cascade. Each step has a defined window before the city moves to the next. The ordering is deliberate: it starts with the party who created the condition (the owner), moves to the parties who have suffered longest from it (adjacent neighbors), then expands to the community, then to any qualified party.
Final compliance notice with concurrent FMV buyout offer. Owner may self-remedy or exit at market rate. Non-response triggers Step 2.
Adjacent parcel owners offered exclusive window to purchase the cleared site at FMV. Basis: proximity freedom — adjacent owners are the primary externality victims and hold the strongest claim on remediated land.
Qualified residential builders within the council district offered the site. Must commit to residential or mixed-use construction within 18 months of acquisition.
Public bid to any qualified developer. Residential or mixed-use required. Short-term commercial repurposing requires council approval. No land-banking permitted.
The proximity freedom argument
Adjacent parcel owners receive priority in Step 2 because they have borne the primary externality cost of the blighted property — lost amenity, suppressed land value, safety risk, visual blight — for the longest period and without remedy. When the city acquires and clears the site, those owners have the strongest moral and economic claim on the remediated land. Offering it to them at fair market value (not a distressed discount) is not a subsidy; it is the restoration of a market condition that was denied to them during the years the blighted property imposed its costs. If they decline, the opportunity passes outward — to the neighborhood, then to any qualified developer.
prototype parcel
267 S Ave 18, Lincoln Heights — the case that prompted this pipeline.
Run:
node scripts/blight/pipeline.mjs --probe "267 S Ave 18" Street View, May 2025. Heading 0° (north). Source: Google Maps.
Blight index scores
| Dimension | Score | Weight |
|---|---|---|
| Vegetation overgrowth | 9/10 | — |
| Structural deterioration | 8/10 | — |
| Debris accumulation | 9/10 | — |
| Abandonment indicators | 9/10 | — |
| Roof condition | 8/10 | — |
| Visual average | 8.6/10 | 40% |
| Violation density | 8 cases → 8/10 | 30% |
| Persistence | 1620d → 8.9/10 | 20% |
| Structural risk | 8.5/10 | 10% |
| Blight score | 8.47 | → Tier 1 |
This parcel illustrates the specific failure mode the pipeline targets: extreme physical distress that is clearly visible in Street View, a long record of open violations, and no evidence of owner investment activity. The conventional enforcement path — continued fining — produces no physical change and imposes ongoing costs on surrounding properties. The parcel is a better candidate for condemnation, remediation, and community-priority sale than for another round of notices.
core finding
The worst cases have no active violation records — which is exactly the problem.
When the pipeline swept the LADBS Customer Service Request dataset for persistent open cases and then queried it specifically for 267 S Avenue 18, it returned zero records. The property is not in the active violation stream. Based on the Street View evidence — advanced vegetation overgrowth, severe debris accumulation, structural roof penetration — that absence is not because the property is in compliance. It is because the fine-to-comply cycle ran its course: violations were opened, fines were paid or ignored until cases aged out, and the cases were closed. The physical condition did not change. The enforcement record did.
The district sweep confirmed this pattern at scale. Of 134 randomly
sampled parcels across 8 CalEnviroScreen extreme-burden tracts
(CES ≥ 90th percentile), two were flagged
invisible_blight — zero active CSR records, but vision scores
high enough to warrant enforcement referral. These are in 99th-percentile
burden tracts in South LA and East LA: neighborhoods already bearing
concentrated environmental cost, where unchecked structural blight
compounds that injustice without ever appearing in the city's enforcement
data.
The violation record is a lagging, gameable indicator. The Street View imagery is not. A parcel that has cycled through the fine-to-comply system and exited it — cases opened, fines paid, cases closed — is structurally invisible to the current enforcement apparatus. Vision-based scoring makes it visible again.
fetchPermitSummary() function already supports this check.
district sweep + human-in-the-loop review
Target environmental damage first, then deploy human review where vision falls short.
The violation-based sweep surfaces parcels that are already in the enforcement system. The district sweep surfaces the ones that are not. It begins with CalEnviroScreen 4.0: every census tract in LA County is ranked by composite pollution burden and population vulnerability score, and the pipeline samples randomly from the highest-scoring tracts. Because environmental damage and structural blight are co-located failures, this targeting approach concentrates samples on the neighborhoods most likely to contain invisible-blight parcels — extreme visual distress with no live enforcement hook.
Why four tracts returned zero parcels
Four of the twelve targeted tracts are in separate incorporated municipalities — Maywood, Huntington Park — whose permit records are not in the LADBS dataset (City of LA jurisdiction only). The sampler silently skips them. This is a feature, not a defect: the pipeline's disposition cascade depends on City of LA enforcement authority; tracts outside that authority are correctly excluded from city-action recommendations.
Human-in-the-loop review
Four gap categories route to a human reviewer rather than an automated tier assignment:
building_not_visible Street View imagery didn't frame the structure at any of the four headings. Human opens the deep link, surveys full 360° Street View, and either confirms no distress or enters observed scores.
invisible_blight Vision score ≥ 7 on at least one dimension, zero active CSR records. Human confirms the visual finding and decides whether to initiate a new enforcement referral. This is the highest-priority review category.
score_borderline Composite blight score 4.5–6.9 — on the Tier 2/3 boundary. Human can upgrade or downgrade based on owner lookup, adjacent property context, or permit history deep-read.
cannot_determine Vision model returned insufficient imagery quality. Manual review required before any disposition recommendation.
The pipeline generates a reviewer CSV (generations/blight/hitl_queue.csv)
with pre-populated vision scores, Street View deep links at all four
headings, and empty override columns. When the reviewer saves the file,
--hitl-merge ingests the overrides, recomputes blight score
and tier, and writes enforcement referral flags back to the candidate
record.
scale and economics
A full citywide Tier-1 sweep costs less than one contested demolition proceeding.
The pipeline runs in two modes. The violation sweep queries LA Open Data city-wide for persistent enforcement cases — costs nothing in API calls, Socrata is auth-free public data. The district sweep targets CalEnviroScreen high-burden tracts and samples random parcels — designed to surface properties that have exited the enforcement system but remain visually distressed. Both modes feed the same classify step, which incurs Street View and vision API costs only for geo-located, unclassified candidates. A targeted re-sweep of Tier-1 candidates every six months, accounting for properties that have been remediated or sold, would cost under $100 per cycle.
For comparison: a single contested nuisance abatement proceeding under California H&S Code §17980 typically takes 18–36 months and costs the city $50,000–$250,000 in staff time, legal fees, and contractor costs — before the property is remediated. A systematic triage pipeline that front-loads vision evidence can accelerate the proceeding and reduce contested cases by presenting physical-condition records at filing rather than building them during litigation.
running the pipeline
Two sweep modes, one review loop, two API keys.
The pipeline lives at scripts/blight/pipeline.mjs. Node.js 20+, two environment variables in .env.local:
GOOGLE_MAPS_API_KEY=...   # Street View Static API enabled
ANTHROPIC_API_KEY=...     # claude-sonnet-4-6 vision
Violation-based sweep (known enforcement cases)
node scripts/blight/pipeline.mjs --sweep Fetches citywide open violation records from LA Open Data, groups by address, and writes candidates.json. Auth-free public data. Typical run: 2–5 minutes for a 12-month filter.
node scripts/blight/pipeline.mjs --classify --limit 100 --yes Runs Street View + vision analysis on unclassified candidates. Idempotent — already-classified parcels are skipped. Prompts for cost confirmation above $5.
node scripts/blight/pipeline.mjs --report Generates candidates.geojson (Mapbox / QGIS) and summary.json with tier counts and top Tier-1 candidates.
District sweep (CalEnviroScreen-targeted, invisible blight)
node scripts/blight/pipeline.mjs --district-sweep --min-ces 90 --samples 30 --districts 10 --yes Fetches top-CES tracts in LA County, draws a stratified random sample of parcels per tract, classifies each via Street View + vision. Merges with any existing candidates and reports HITL flags. Tracts outside City of LA jurisdiction return zero parcels and are skipped automatically.
Human-in-the-loop review
node scripts/blight/pipeline.mjs --hitl-queue Generates hitl_queue.csv — one row per flagged parcel with pre-populated vision scores, Street View deep links at all four headings, and empty override columns for the reviewer.
node scripts/blight/pipeline.mjs --hitl-merge generations/blight/hitl_queue_reviewed.csv Ingests reviewer overrides from the completed CSV, recomputes blight score and tier, writes enforcement referral flags, and re-runs the report. Reviewer columns: override_vegetation, override_structural, override_debris, override_abandonment, override_roof, override_tier, enforcement_referral (yes/no).
node scripts/blight/pipeline.mjs --probe "267 S Ave 18" Geocodes and classifies a single address. Useful for spot-checking vision scoring against known-condition properties.
sources and legal basis