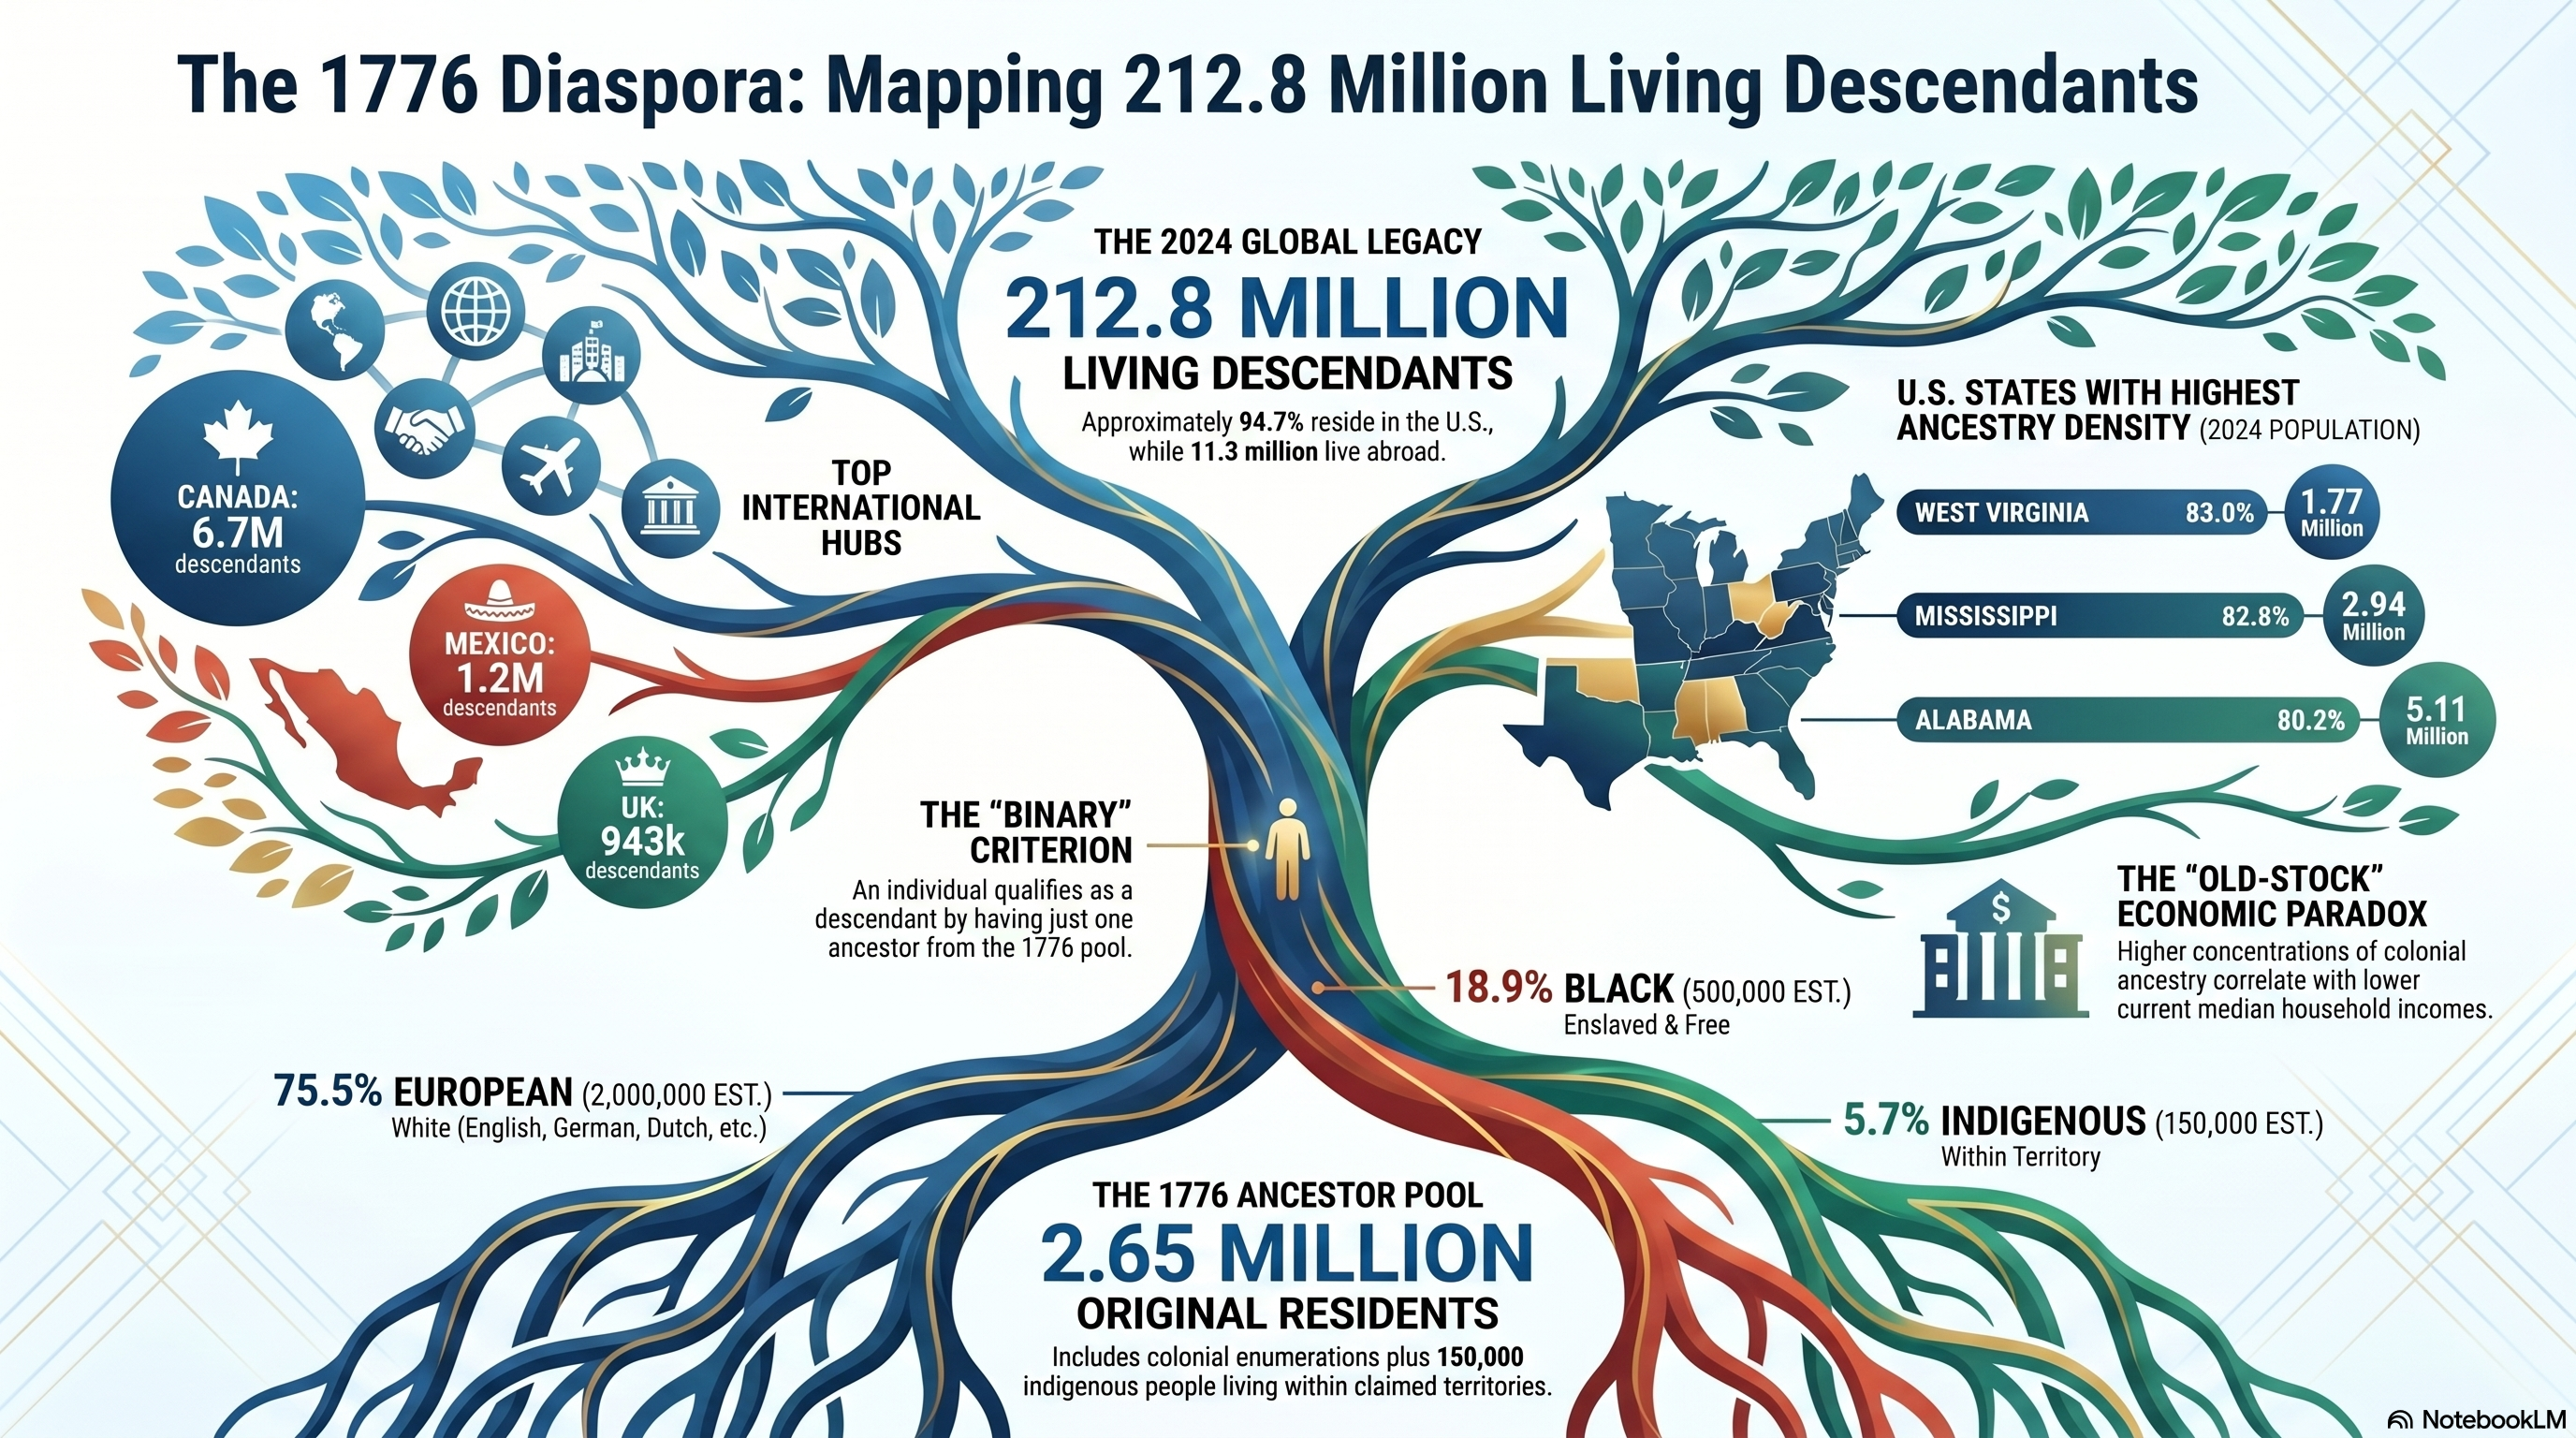
Estimate the global living population of individuals with at least one ancestor
who was alive and residing in the territory of the Thirteen Colonies in 1776.
The criterion is binary: a single colonial ancestor anywhere in the family tree
is enough.
U.S. states · share with ≥1 colonial ancestor
other countries · descendants per 1,000 residents
global, today——
in the United States——
outside the United States——
loading dataset…
1776 Baseline · who actually lived here
The estimator treats the 13 colonies' 1776 territory as the ancestor pool.
Roughly 2.65 million people resided in that territory once Indigenous nations
living within colonial claims are counted alongside the U.S. Census Bureau's
colonial enumeration. The left panel shows the racial distribution; the right
panel names individuals from races other than white-European or
Black-African — almost entirely Indigenous, with a brief note on the
near-absence of documented Asian residents.
Racial distribution, ~2.65M residents
Indigenous count is given as 150k (90% range 100k–200k). The U.S. Census Bureau's 2.5M figure enumerates only the colonial population; we add Indigenous nations residing inside the colonies' claimed boundaries to get the territorial denominator.
Notable residents in 1776 — faces by category
Indigenous nations of the 1776 sphere
The colonial population in 1776 lived alongside ~15 Indigenous nations whose
territory lay within or directly adjacent to the Thirteen Colonies. Roughly
150,000 people total — Cherokee largest, then the Iroquois Confederacy and
Muscogee Creek. Modern enrolled counts (federally + state-recognized
successor nations) are shown alongside; descendant figures use a loose
definition (anyone with documented descent, enrolled or not) and run several
times higher. Hover for the 1776 → today trajectory.
—
Challenge the assumptions
Three knobs move the answer the most. Drag to see how the headline number
and country breakdown shift. The map of population locations is the same
dataset; only the lineage math changes.
0.93
Pew/ancestry literature anchors this near 0.93. Lower it and the share of total ancestry that must come from the white population rises (and the reconciler may flag infeasible).
1.00
Multiplies each decade's ancestry_share prior. 1.0 keeps the published curve; below 1 says recent emigrants carry less colonial lineage than the literature suggests; above 1 says more.
1.55
Surviving descendants per parent, per 25-year generation. 1.0 is exact replacement; 1.55 is the mid-range fertility-and-survival assumption used here.
0.60
The Ancestry.com 2010 figure. Drives the back-solve for the white-American rate.
U.S. breakdown by race
Back-solved from the national identity. The reconciler is feasible iff the
implied white-American rate lands inside [0, 1].
⚠ priors infeasible: implied white rate falls outside [0, 1]. Widen one prior.
Diaspora map
Each dot sits at a receiving country's centroid; radius scales with descendant
count under the current assumptions. Hover for the per-country breakdown by
departure decade. Loyalist (1783) cohorts are shown in warm yellow; voluntary
emigrant flows in cool blue.
By U.S. state
Per-state share of residents with at least one ancestor present in the
Thirteen Colonies in 1776. Each row applies the same race-share reconciler
to that state's ACS demography, scaled by a state-specific
colonial_stock_factor hand-curated from the 2000 Census detailed-
ancestry tables and known settlement-stream geography. Sliders above
re-run the math live.
—RswingD
2024
—
Compare two states
Side-by-side snapshot for any two jurisdictions. Ancestry rates re-run as
the sliders move; demographic and economic indicators are 2023-2024 ACS /
BEA / CDC and stay fixed.
vs.
Does 1776 ancestry correlate with lower state income?
PDC hypothesis: high state-level concentrations of 1776 ancestry signal a
lack of recent in-migration (a proxy for lack of recent economic
development), so old-stock states should be poorer. Plot below: each dot is
a state, x-axis is its f_state, y-axis is its 2023 median
household income. Color follows the political-lean swatch. The
straight line is a least-squares fit on the visible data.
The chart always uses the current-year (2024) ancestry rate, so it stays
comparable with the 2023 income axis even when the historical timeline above
is moved.
—
Country detail
Sorted by descendant count, with each country's lineage decomposed by departure
decade. The "Loyalist" band is the 1783 cohort with ancestry_share locked at
1.0; the engine treats those descendants as a separate seeded propagator.
Sensitivity
Elasticity of the global total to a 5% change in each knob, evaluated at the
baseline assumption point. Positive values mean increasing the knob increases
the answer.