GIS study — generated 2026-05-17
economic GIS study
Does Los Angeles preserve its historic buildings where land is most valuable — and does that restriction land hardest on low-income neighborhoods? This study places all 1295 active HCMs on a tract grid of LA County (≈2,500 tracts) and compares the spatial signature of preservation against four economic layers: land value, household income, jobs-per-resident, and reported crime.
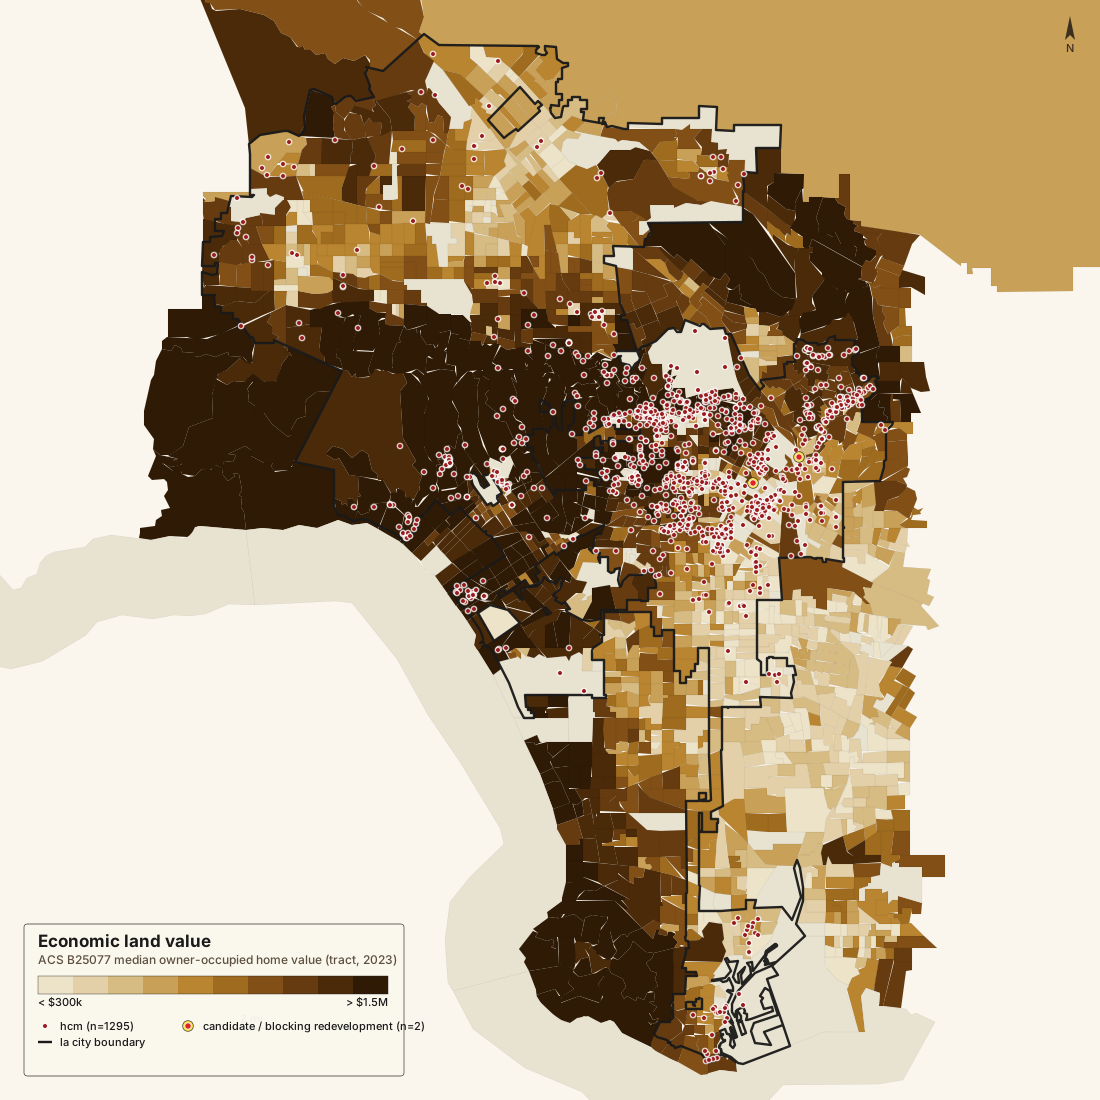
54.1% of HCMs sit in the top 30% of tracts by median home value. Only 9.4% sit in the bottom 30%. Preservation concentrates in expensive land.
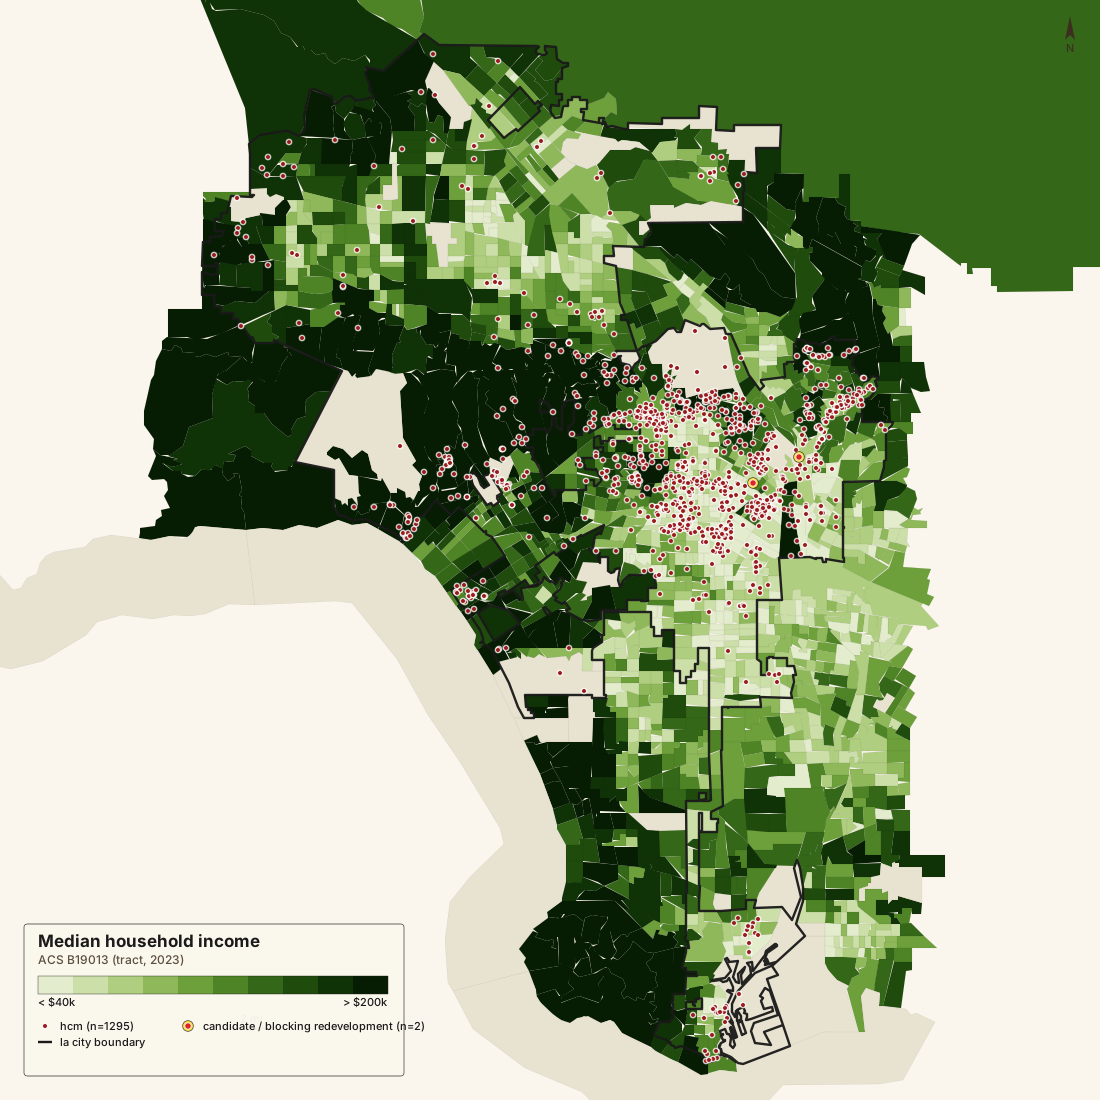
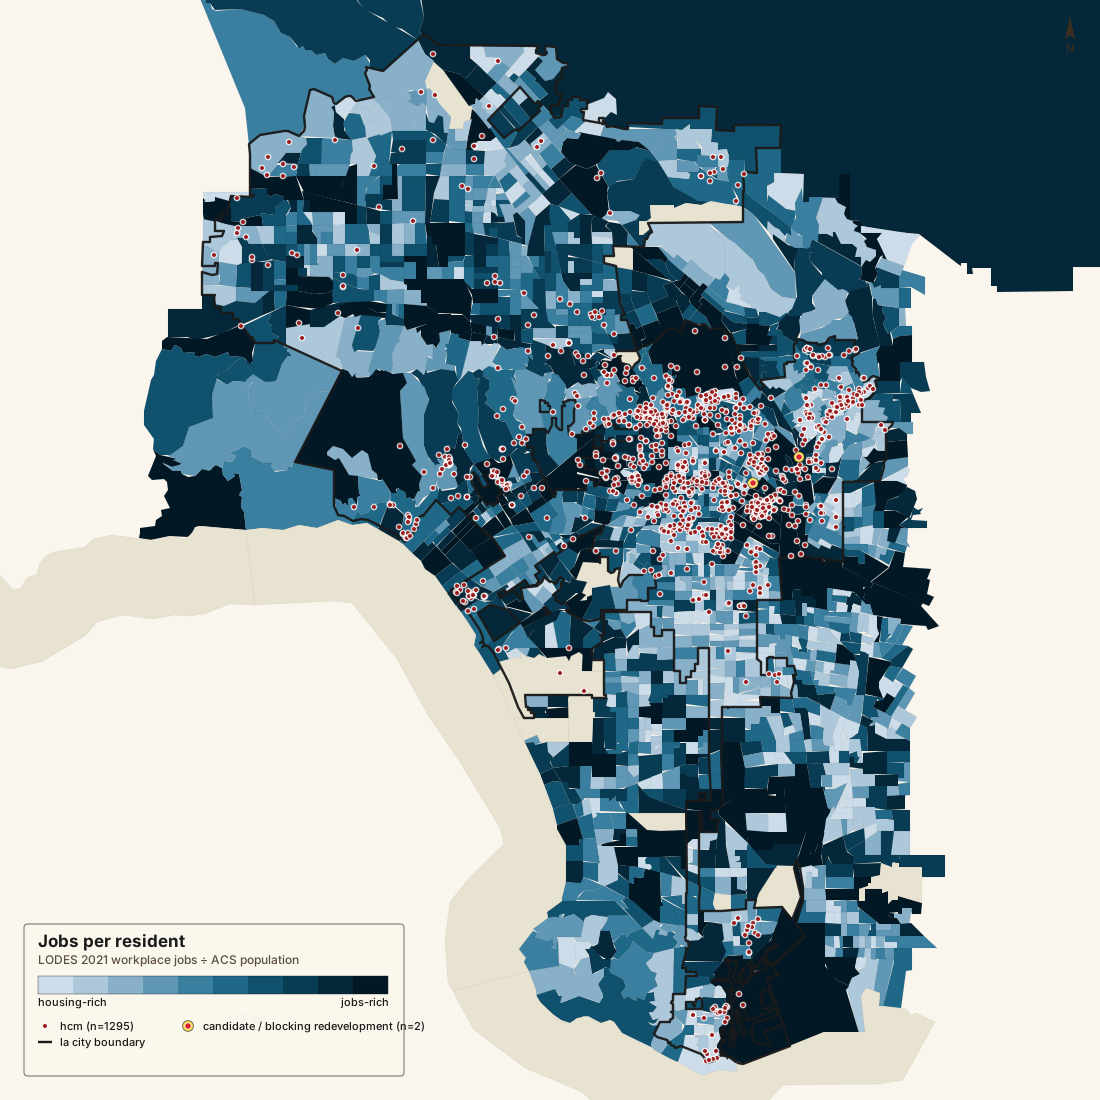
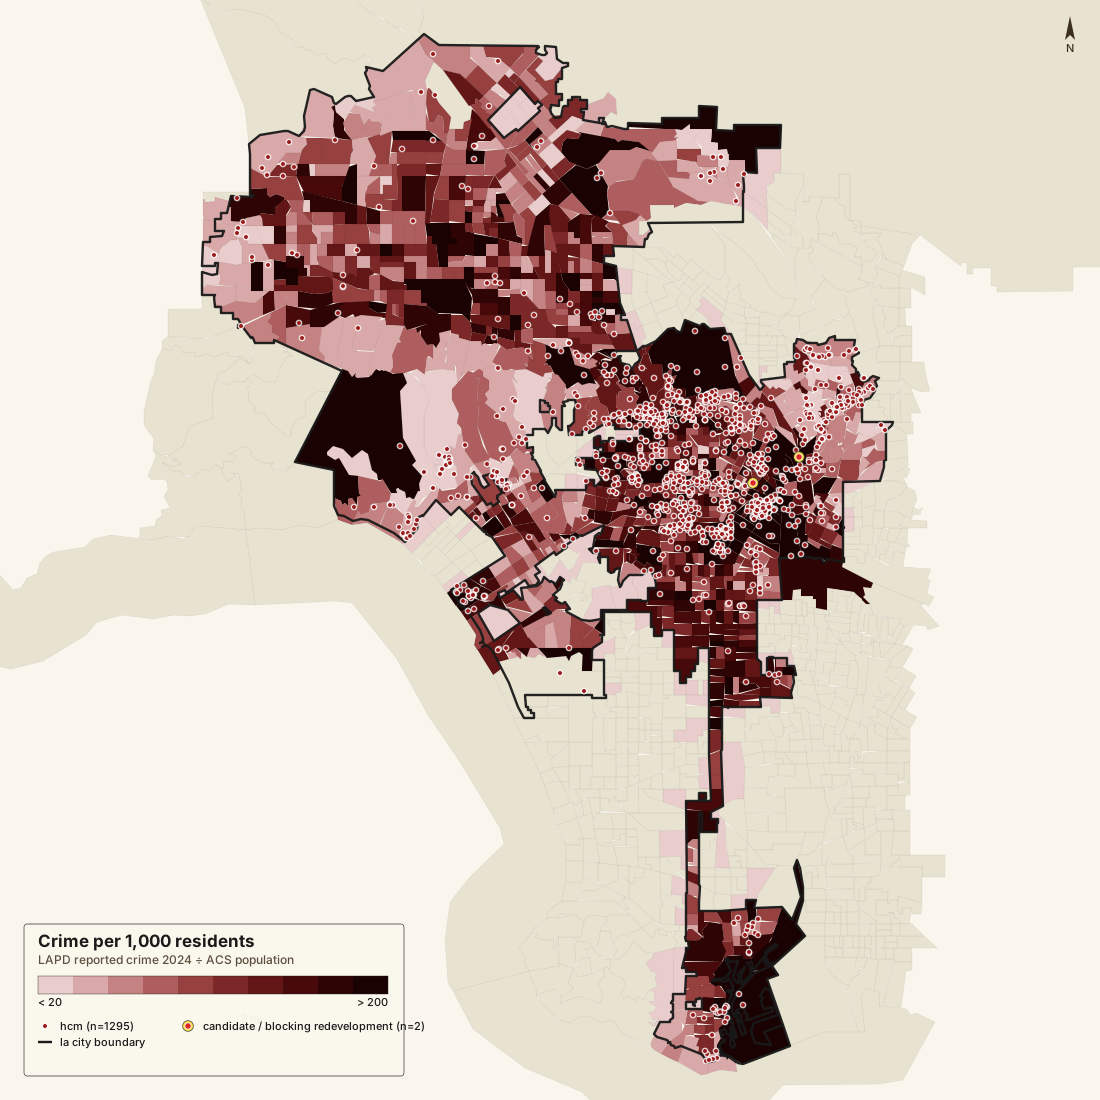
HCM HCM flagged candidate / blocking redevelopment by the audit's rubric LA City boundary (only buildings inside are eligible for HCM)
HCM concentration by tract decile
For each metric, the table shows how many of the 1295 tract-matched HCMs fall into each decile of LA County tracts. A uniform distribution would put ~10% in each decile. Heavy skew to high deciles (d8–d10) means HCMs cluster in the high-value / high-income / jobs-rich / high-crime end of the city. Heavy skew to low deciles means the opposite.
| metric | bottom 30% (d1–d3) | middle 40% (d4–d7) | top 30% (d8–d10) | unranked |
|---|---|---|---|---|
| Economic land value | 122 (9.4%) | 271 (20.9%) | 701 (54.1%) | 201 |
| Median household income | 539 (41.6%) | 357 (27.6%) | 374 (28.9%) | 25 |
| Jobs per resident | 245 (18.9%) | 518 (40.0%) | 530 (40.9%) | 2 |
| Crime per 1,000 residents | 229 (17.7%) | 453 (35.0%) | 611 (47.2%) | 2 |
If HCM placement were random across LA County tracts, each row would read 30 / 40 / 30. Deviations identify the spatial signature of the designation regime — does it cover where the city is valuable, where it is poor, where it has jobs, or where it has crime?
Findings
1295 of 1295 HCMs joined cleanly to a tract. Placement is non-random against every one of the four metrics:
- Land value — heavy top-skew (+24.1). 54.1% of HCMs in the top-3 deciles, 9.4% in the bottom-3. Preservation concentrates in expensive land.
- Household income — bottom-skew (+11.6 in bottom-3). 41.6% of HCMs in the lowest-income tracts, only 28.9% in the highest-income tracts. Combined with the land-value finding, this is the gentrification-pressure signature — pre-war architecture in working-class neighborhoods where the land has appreciated past the people on it.
- Jobs per resident — top-skew (+10.9). 40.9% of HCMs in jobs-rich tracts (Downtown, Hollywood, Koreatown, Mid-Wilshire). These are where market pressure to redevelop is strongest, so the opportunity cost of designation friction is highest.
- Crime per capita — top-skew (+17.2). 47.2% of HCMs in the highest-crime tracts. Crime is downstream of urban density, not a cause of designation — but the overlap means preservation policy is concentrated in neighborhoods already carrying disproportionate enforcement load.
The four signals together: preservation in LA is concentrated on dense, expensive, jobs-rich, lower-income, higher-crime land. That profile fits the "saving old neighborhoods from speculation" defense and the "blocking higher-value use in the wrong places" critique equally well. Discriminating between them requires the parcel-level six-axis rubric on the HCM-1200 page.
Hollywood — 536 HCMs mapped by condition & economic potential
All 536 HCMs within the Hollywood community plan area plotted against land value. Dot color = structural/occupancy condition. Dot size = estimated redevelopment potential. Gold diamonds = major tourist anchors (Walk of Fame, TCL Chinese Theatre, Dolby Theatre, Hollywood Bowl). Dashed red ring = building actively detracting from tourist experience (vacant or failing in high-exposure location).
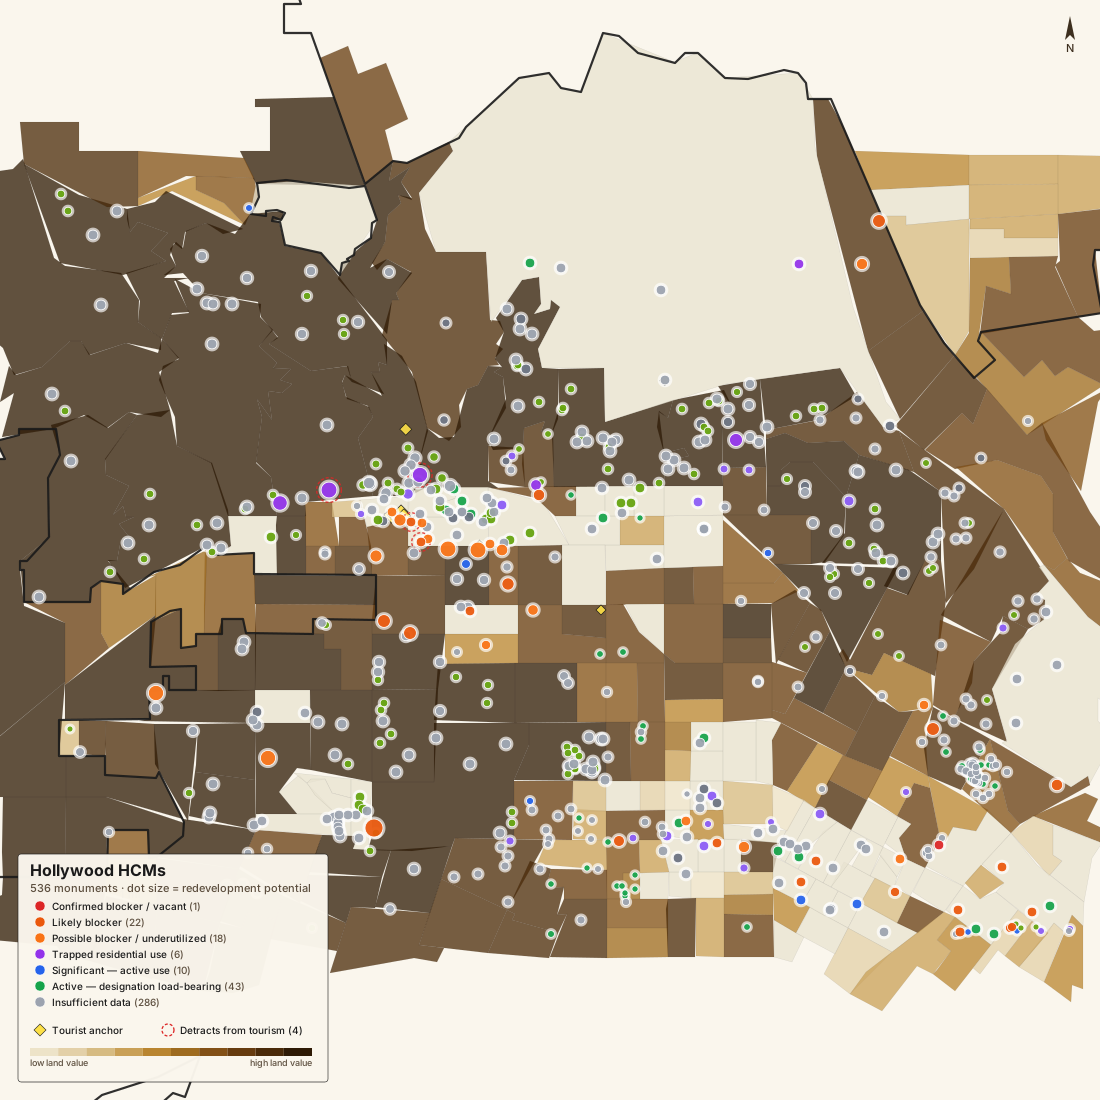
41 Blocking or underutilizing premium land
0 Documented structural failure
6 Trapped residential below economic potential
4 Detracting from tourism (vacant/failing in tourist zone)
5 Actively contributing to tourist experience
Top 20 by estimated redevelopment potential
Current est = 65% of tract median home value (parcel-to-tract discount). Potential est = current × necessity-based density uplift × tourism premium. Uplift multiples: confirmed blocker 8.5×, likely blocker 7×, possible blocker 5.5×, trapped residential 5×, architecturally significant 1.8×.
| building | condition | current est | potential est | uplift | tourism |
|---|---|---|---|---|---|
| Southern California Telephone Company Exchange 650-668 South La Brea Avenue | Likely blocker | $1.30M | $9.1M | 7× | Peripheral |
| C.E. Toberman Estate 1847 Camino Palmero | Trapped residential — below economic potential | $1.30M | $7.5M | 5.8× | Likely detracts |
| Pacifics Cinerama Dome Theatre and Marquee 6360 Sunset Boulevard | Possible blocker — underutilized | $1.01M | $7.5M | 7.4× | Mixed |
| Fred C. Thomson Building 6536 Sunset Boulevard & 1450 Seward Street | Possible blocker — underutilized | $1.01M | $7.5M | 7.4× | Mixed |
| Farmers Market West 3rd Street / Fairfax Avenue and Gilmore Lane | Possible blocker — underutilized | $1.30M | $7.2M | 5.5× | Peripheral |
| Norm's La Cienega Coffee Shop 470 North La Cienega Boulevard | Possible blocker — underutilized | $1.30M | $7.2M | 5.5× | Peripheral |
| Roman Gardens 2000 North Highland Avenue | Trapped residential — below economic potential | $1.06M | $7.1M | 6.8× | Likely detracts |
| Courtney Desmond Estate 1801-1811 Courtney Avenue | Trapped residential — below economic potential | $1.30M | $6.5M | 5× | Peripheral |
| Monterey Apartments 4600-4604 Los Fellz Boulevard | Trapped residential — below economic potential | $1.10M | $5.5M | 5× | Peripheral |
| Community Laundry Company Building 900-930 North Highland Avenue | Likely blocker | $0.77M | $5.4M | 7× | Peripheral |
| Howard Hughes Headquarters 7000-7020 Romaine Street; 930-956 North Sycamore Avenue; 931-953 North Orange Drive | Likely blocker | $0.77M | $5.4M | 7× | Peripheral |
| Echo Park 751 North Echo Park Avenue | Likely blocker | $0.77M | $5.4M | 7× | Peripheral |
| McKee General Contractor Office 4101 East Goodwin Ave & 4701 San Fernando Road | Likely blocker | $0.76M | $5.3M | 7× | Peripheral |
| YWCA Hollywood Studio Club 1215-1233 Lodi Place | Likely blocker | $0.72M | $5.0M | 7× | Neutral |
| Charlie Chaplin Studios 1416 North La Brea Avenue and 7053-7067 De Longpre Avenue | Possible blocker — underutilized | $0.65M | $4.8M | 7.4× | Mixed |
| El Capitan Theater Building 6834-6838 Hollywood Boulevard | Possible blocker — underutilized | $0.65M | $4.8M | 7.4× | Mixed |
| Earl Carroll Theater 6220-6230 Sunset Boulevard | Possible blocker — underutilized | $0.72M | $4.5M | 6.3× | Mixed |
| Chateau Elysee 5925-5939 Yucca Street, 5930-5936 Franklin Avenue, and 1806-1830 Tamarind Avenue | Likely blocker | $0.63M | $4.4M | 7× | Neutral |
| The Outpost 11 1851 Outpost Drive | Insufficient data — reassess | $1.30M | $4.4M | 3.4× | Neutral |
| N.F. Stokes Residence 1905 Grace Avenue | Insufficient data — reassess | $1.30M | $4.4M | 3.4× | Neutral |
Source: tract land value (ACS 5yr 2023 via ESRI Living Atlas); redevelopment potential is an indicative model, not a formal appraisal. Tourism scores use Walk-of-Fame anchor set (10M annual visitors) with inverse-distance weighting. Full dataset (JSON)
Hollywood — focused cluster maps by tract & street
Zoomed views of the 4 highest-density HCM concentrations within the Hollywood community plan area. Each map shows individual census tract boundaries (colored by median land value), named street rights-of-way from OpenStreetMap, and all HCMs within the view colored by structural condition and sized by estimated redevelopment potential.
#1 Echo Park 55 HCMs
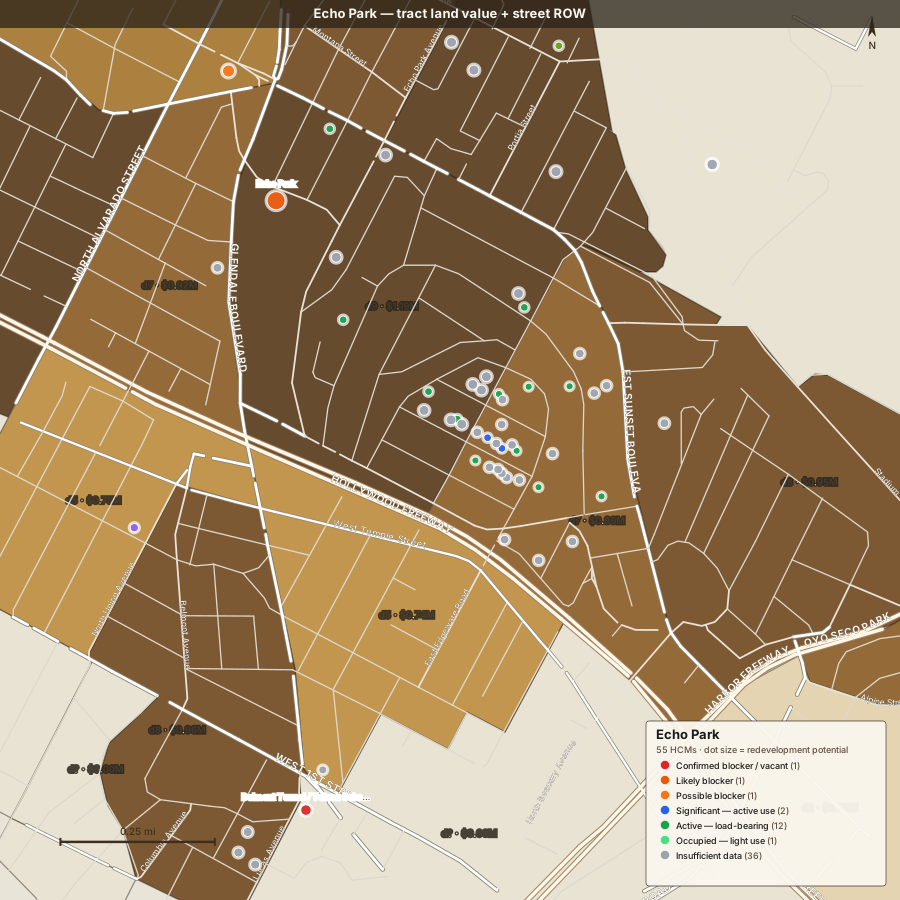
- unknown 36
- active 12
- significant active 2
- likely blocker 1
- possible blocker 1
#2 La Brea / Mid-Wilshire 26 HCMs
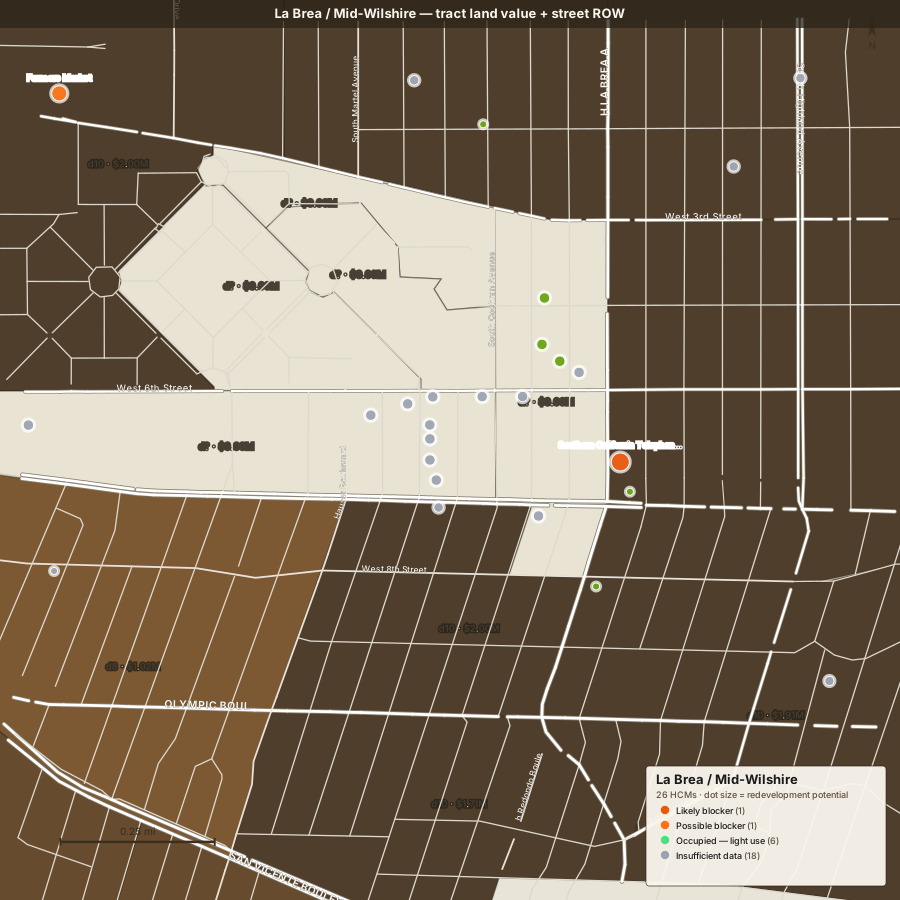
- unknown 18
- occupied light 6
- likely blocker 1
- possible blocker 1
#3 Mid-Hollywood 69 HCMs
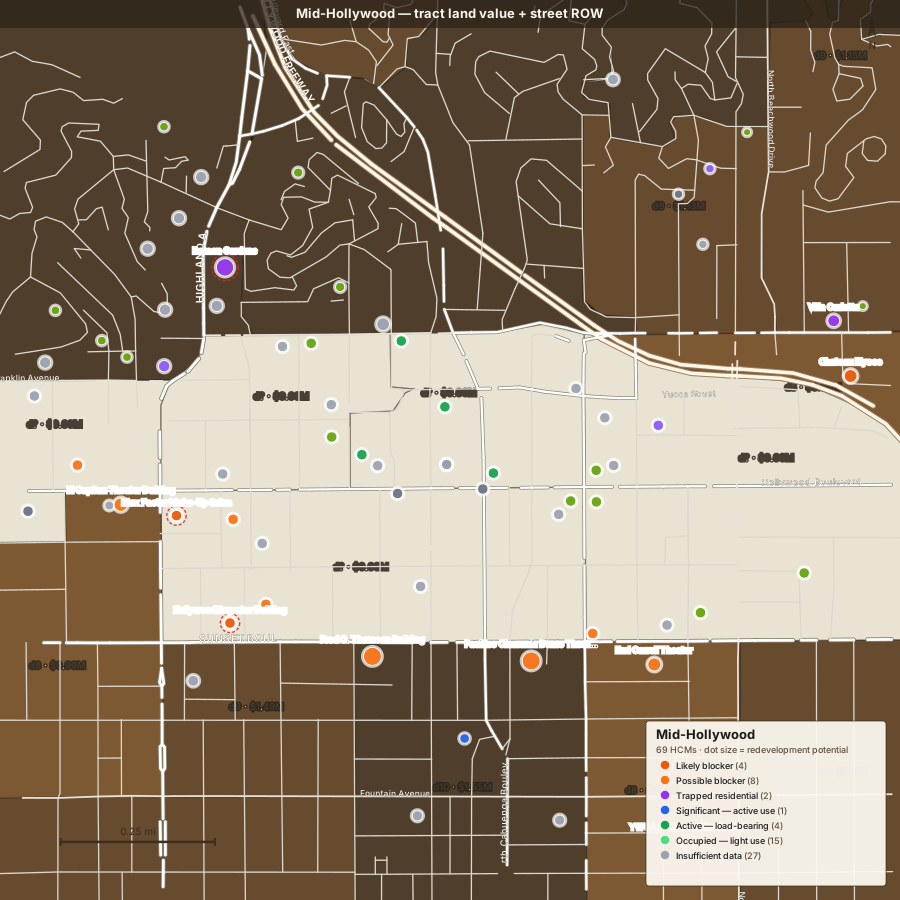
- unknown 27
- occupied light 15
- possible blocker 8
- redundant 5
- likely blocker 4
#4 Larchmont / Melrose 47 HCMs
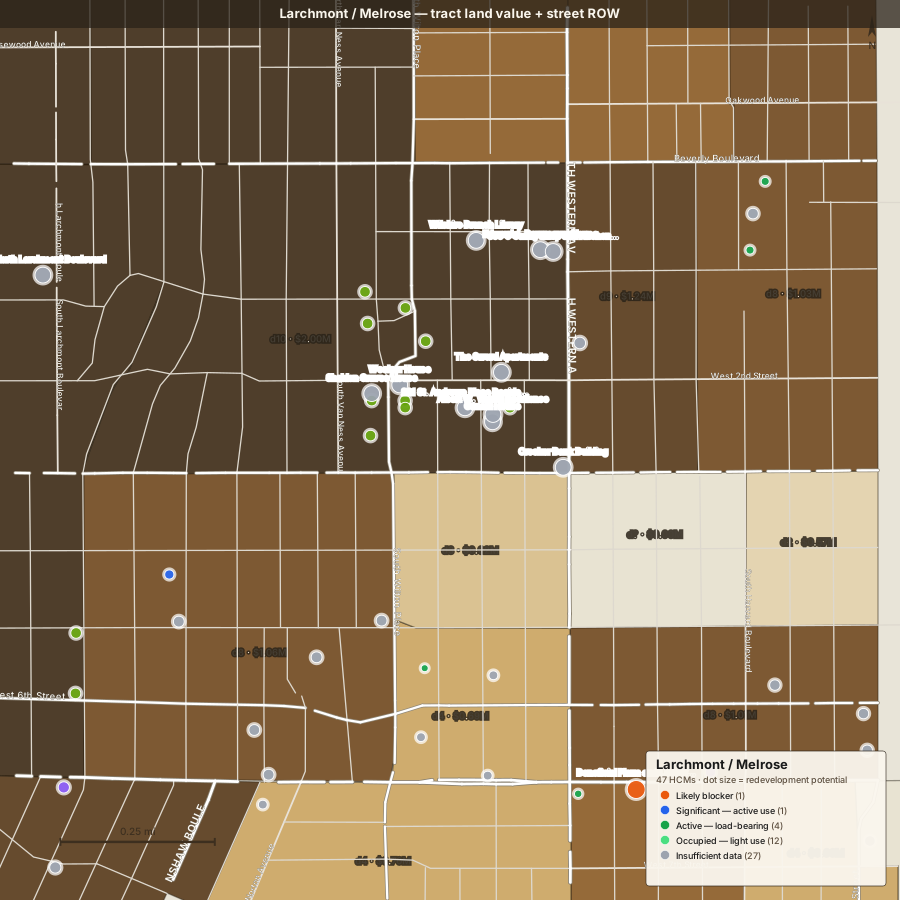
- unknown 27
- occupied light 12
- active 4
- exempt 2
- likely blocker 1
Maps generated from OpenStreetMap road data (© OSM contributors, ODbL). Tract data: ACS 5yr 2023. Focus area: ±0.01° lat × ±0.012° lon (~1.4 mi) around the densest HCM grid cell.
Opportunity zones — high-frequency blocking clusters
Grid-cell hotspot analysis (≈0.4 mi cells) merged into 8 contiguous zones where HCM legislation is most concentrated against high-value land. Zones are ranked by cumulative opportunity score (sum of land value decile × housing density gap across all buildings in zone). Each numbered rectangle on the map is a distinct opportunity zone.
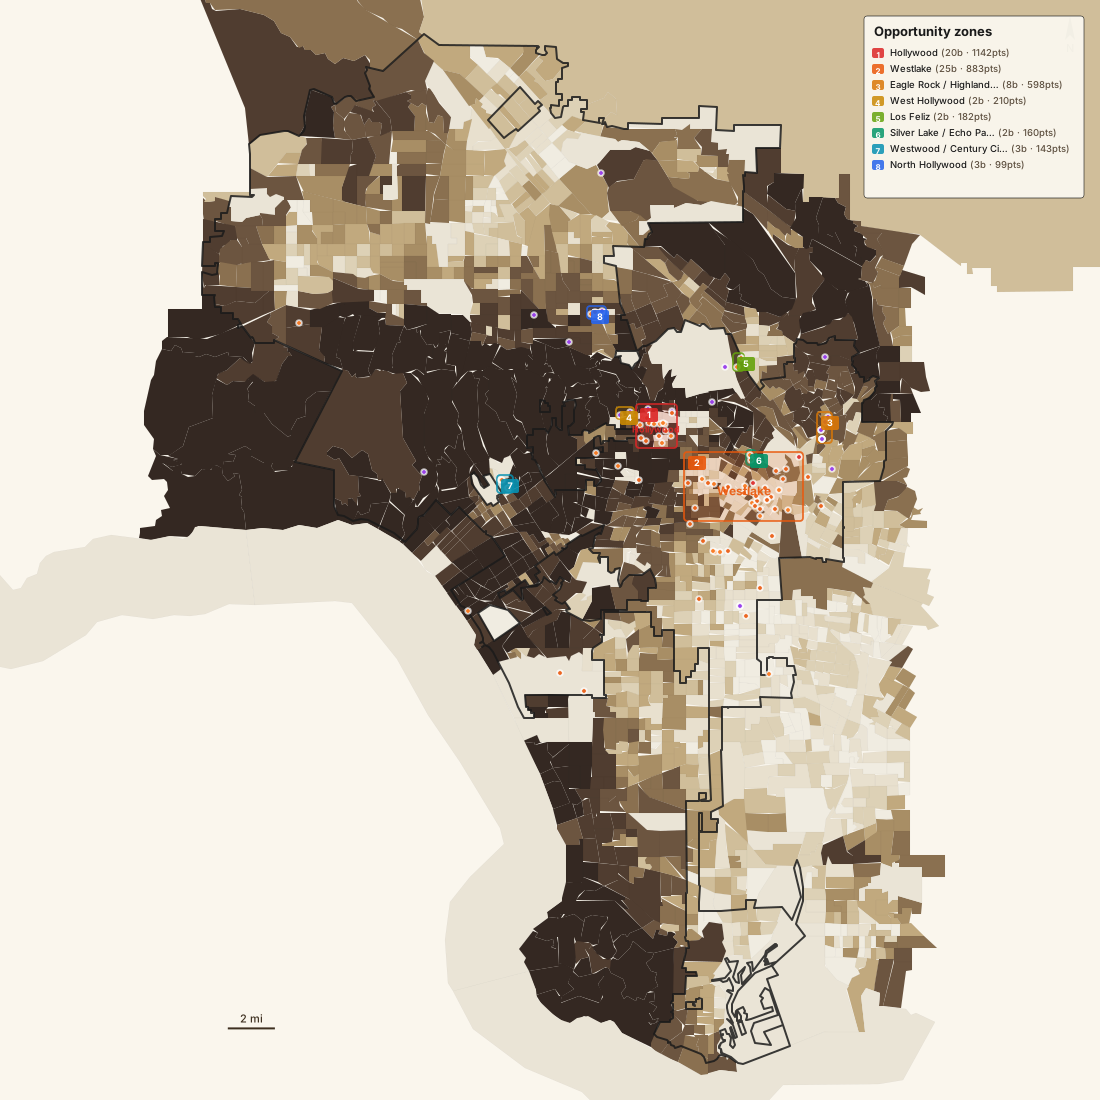
- #1 Hollywood 1142 ptsLead blocker: Roman Gardens — trapped use
- 102 Roman Gardens — 2000 North Highland Avenue
- 101 Pacifics Cinerama Dome Theatre and Marquee — 6360 Sunset Boulevard
- 101 Fred C. Thomson Building — 6536 Sunset Boulevard & 1450 Seward Street
- 94 Villa Carlotta — 5959 Franklin Avenue
- 92 Community Laundry Company Building — 900-930 North Highland Avenue
- +15 more
- #2 Westlake 883 ptsLead blocker: Bullock's Wilshire Building — possible blocker
- 94 Bullock's Wilshire Building — 2973-2989 West 7th Street, 658-690 Westmoreland Avenue, 3050-3070 Wilshire Boulevard, and 655-685 Wilshire Place
- 83 Naval and Marine Corps Reserve Center — 1700 East Stadium Way
- 81 Harris Newmark Building — 127 East 9th Street
- 81 State Theater Building — 701-723 South Broadway and 300-314 West 7th Street
- 72 Cathedral High School — 1253 Bishops Road
- +20 more
- #3 Eagle Rock / Highland Park 598 ptsLead blocker: Valley Knudsen Garden and Residence (Heritage Square) — trapped use
- 78 Valley Knudsen Garden and Residence (Heritage Square) — 3800 Homer Street
- 78 Mount Pleasant House (Heritage Square) — 3800 Homer Street
- 78 Beaudry Avenue House — 3800 Homer Street
- 78 Octagon House (Heritage Square) — 3800 Homer Street
- 78 Ivar I. Phillips Dwelling — 4200 North Figueroa Street
- +3 more
- #4 West Hollywood 210 ptsLead blocker: C.E. Toberman Estate — trapped use
- 105 C.E. Toberman Estate — 1847 Camino Palmero
- 105 Courtney Desmond Estate — 1801-1811 Courtney Avenue
- #5 Los Feliz 182 ptsLead blocker: Albert Van Luit Complex — possible blocker
- 91 Albert Van Luit Complex — 4000-4010 East Chevy Chase Drive
- 91 McKee General Contractor Office — 4101 East Goodwin Ave & 4701 San Fernando Road
- #6 Silver Lake / Echo Park 160 ptsLead blocker: Echo Park — likely blocker
- 96 Echo Park — 751 North Echo Park Avenue
- 64 TAIX French Restaurant — 1911 West Sunset Boulevard & 1980 Reservoir Street
- #7 Westwood / Century City 143 ptsLead blocker: Fox Bruin Theater — possible blocker
- 71 Fox Bruin Theater — 926-950 Broxton Avenue and 10935-10943 Weyburn Avenue
- 71 Holmby Building — 901-951 South Westwood Boulevard
- 1 Westwood Village Memorial Park — 1218 Glendon Avenue
- #8 North Hollywood 99 ptsLead blocker: Amelia Earhart Branch (North Hollywood Branch Library) — possible blocker
- 95 Amelia Earhart Branch (North Hollywood Branch Library) — 5211 North Tujunga Avenue
- 2 El Portal Theater — 5265-5271 Lankershim Boulevard and 11200-11220 Weddington Street
- 2 Weddington House — 11025 West Weddington Street
Redevelopment opportunity — buildings blocking higher use
97 HCMs are classified as actively blocking redevelopment or trapping lower uses than their site conditions support. The map below plots them by opportunity score (land value decile × housing-rich location gap). Larger dots = higher opportunity cost. Colors separate confirmed blockers from likely, possible, and use-trapping patterns.
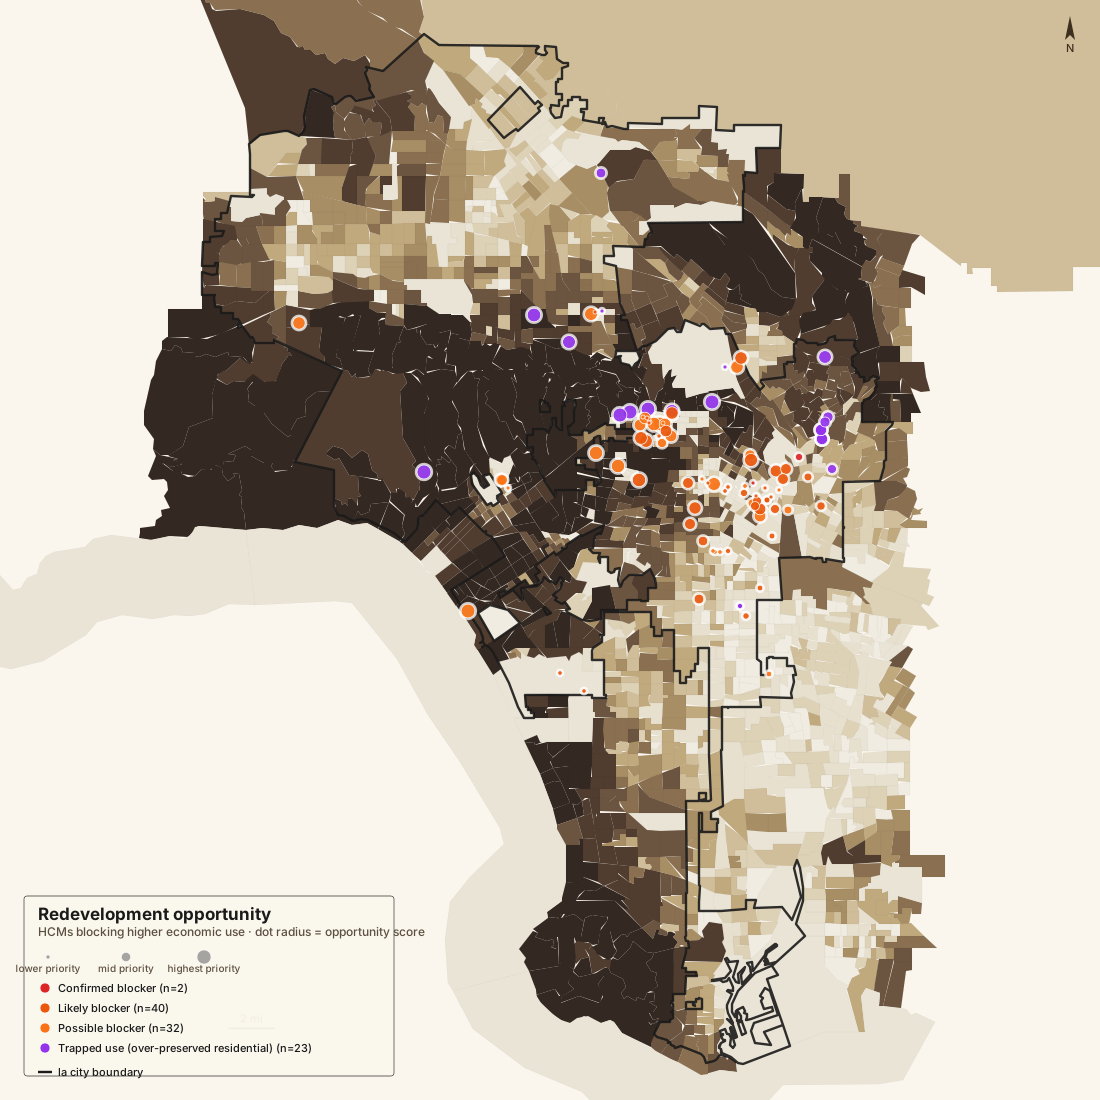
By neighborhood Download full ranked list (CSV)
| neighborhood | buildings | avg opportunity score | avg land value | top blocker | type |
|---|---|---|---|---|---|
| Brentwood / Bel Air | 1 | 107 | $2.00M | Cliff May Experimental House | trapped use |
| West Hollywood | 4 | 103 | $2.00M | C.E. Toberman Estate | trapped use |
| Mid-Wilshire | 1 | 101 | $2.00M | Southern California Telephone Company Exchange | likely blocker |
| San Fernando Valley (West) | 1 | 91 | $1.12M | Pepper Trees (Ventura Boulevard to Saltillo Street) | possible blocker |
| Silver Lake / Echo Park | 3 | 81 | $0.98M | Echo Park | likely blocker |
| Eagle Rock / Highland Park | 9 | 77 | $0.93M | Argus Court | trapped use |
| Los Feliz | 4 | 72 | $1.34M | Monterey Apartments | trapped use |
| San Fernando Valley (East) | 6 | 60 | $1.20M | The Magnolia | trapped use |
| Hollywood | 20 | 57 | $1.17M | Roman Gardens | trapped use |
| Koreatown | 5 | 52 | $1.00M | Bullock's Wilshire Building | possible blocker |
| Westwood / Century City | 3 | 48 | $0.91M | Fox Bruin Theater | possible blocker |
| Boyle Heights | 1 | 45 | $0.67M | Brooklyn Avenue Neighborhood Corridor | likely blocker |
| El Sereno / Lincoln Heights | 3 | 42 | $0.68M | Villa Rafael | trapped use |
| Culver City / Venice | 3 | 38 | $2.00M | Venice Lifeguard Station | possible blocker |
| Downtown | 17 | 36 | $0.74M | Harris Newmark Building | possible blocker |
| West Adams / Crenshaw | 4 | 36 | $0.83M | Residence | likely blocker |
| South LA | 5 | 25 | $0.55M | Cadet Records | likely blocker |
| Watts / Southeast LA | 1 | 15 | $0.54M | Watts City Hall and Engine Company No. 65 | possible blocker |
| Westlake / MacArthur Park | 6 | 10 | $0.62M | Pacific Dining Car | likely blocker |
Opportunity score = land value decile (0–10) × 10 + (11 − jobs-per-resident decile). Higher scores indicate more expensive land being under-occupied relative to surrounding density. Neighborhood assignment uses nearest centroid from 19 major LA districts.
Method & sources
What is being measured
Tract-level spatial-correlation: every LA County tract gets a value on each metric, then each HCM is point-in-polygon-joined to its tract. The decile distribution of those tracts is the spatial signature of the designation regime against that metric. This is not a parcel-level economic appraisal — for that, see the six-axis rubric on the HCM-1200 page.
Economic land value proxy
Median owner-occupied home value (ACS B25077_001E) — structure-plus-land, but at the tract scale it correlates closely with both assessed land value and recent transaction prices. Tracts dominated by rentals (e.g. Downtown) often have null B25077 and show as "unranked".
Household income
Median household income (ACS B19049_001E, all householders).
Jobs per resident
Jobs (LEHD LODES 2021 WAC, all workers) ÷ population (ACS B01001_001E). LODES counts where workers work, not where they live — so high deciles are jobs centers (DTLA, Century City, Hollywood), low deciles are residential exporters.
Crime per 1,000 residents
LAPD crime data via the Socrata API (2nrs-mtv8.json), 2024 calendar year, geolocated incidents only — LAPD suppresses lat/lon for incidents involving juveniles or specific privacy categories, so this undercounts in tracts where suppression rates are higher.
LA City boundary
Only buildings inside the heavy black line are eligible for HCM designation. Surrounding county tracts (Beverly Hills, Culver City, West Hollywood, Pasadena, Long Beach, the unincorporated strips) are rendered for context but cannot host an HCM. LA City is discontiguous — the line traces the main contiguous area plus the San Pedro / Wilmington panhandle and a small Palisades exclave.
Decile bucketing
Each metric is percentile-ranked across all LA County tracts with a non-null value. Ranks → deciles 1-10. HCMs join their tract via point-in-polygon on parcel centroid coordinates. Unranked = the HCM's tract has a null metric (typically no owner-occupied housing for B25077, or zero population for the ratios).
Limitations
Tract-level medians hide parcel variation — a single tract may contain a $5m hillside parcel and a $400k flatlands parcel. For the HCM-1200 question this is a feature, not a bug; the audit is asking whether the regime concentrates in spatially-coherent areas, not whether any one parcel is mispriced. Crime is one calendar year. Land value is the latest 5-year ACS (≈2018–2022), so it lags the current market by ~2 years.
Sources
- Tracts: TIGERweb 2020 Census tracts
- LA City boundary: LA City Planning GIS
- ACS 5-year (latest, ≈ 2018–2022): ESRI Living Atlas — population and housing basics (B25077, B01001) and median household income (B19049). These are ESRI-hosted feature services that re-publish the Census ACS tables without requiring a Census API key.
- Jobs: LEHD LODES8 2021 — WAC + RAC.
- Crime: LAPD crime data 2020-present
- HCM coordinates: this audit's HCM-1200 register