hcm-1200 · policy analysis
who actually wins — and what it costs everyone else
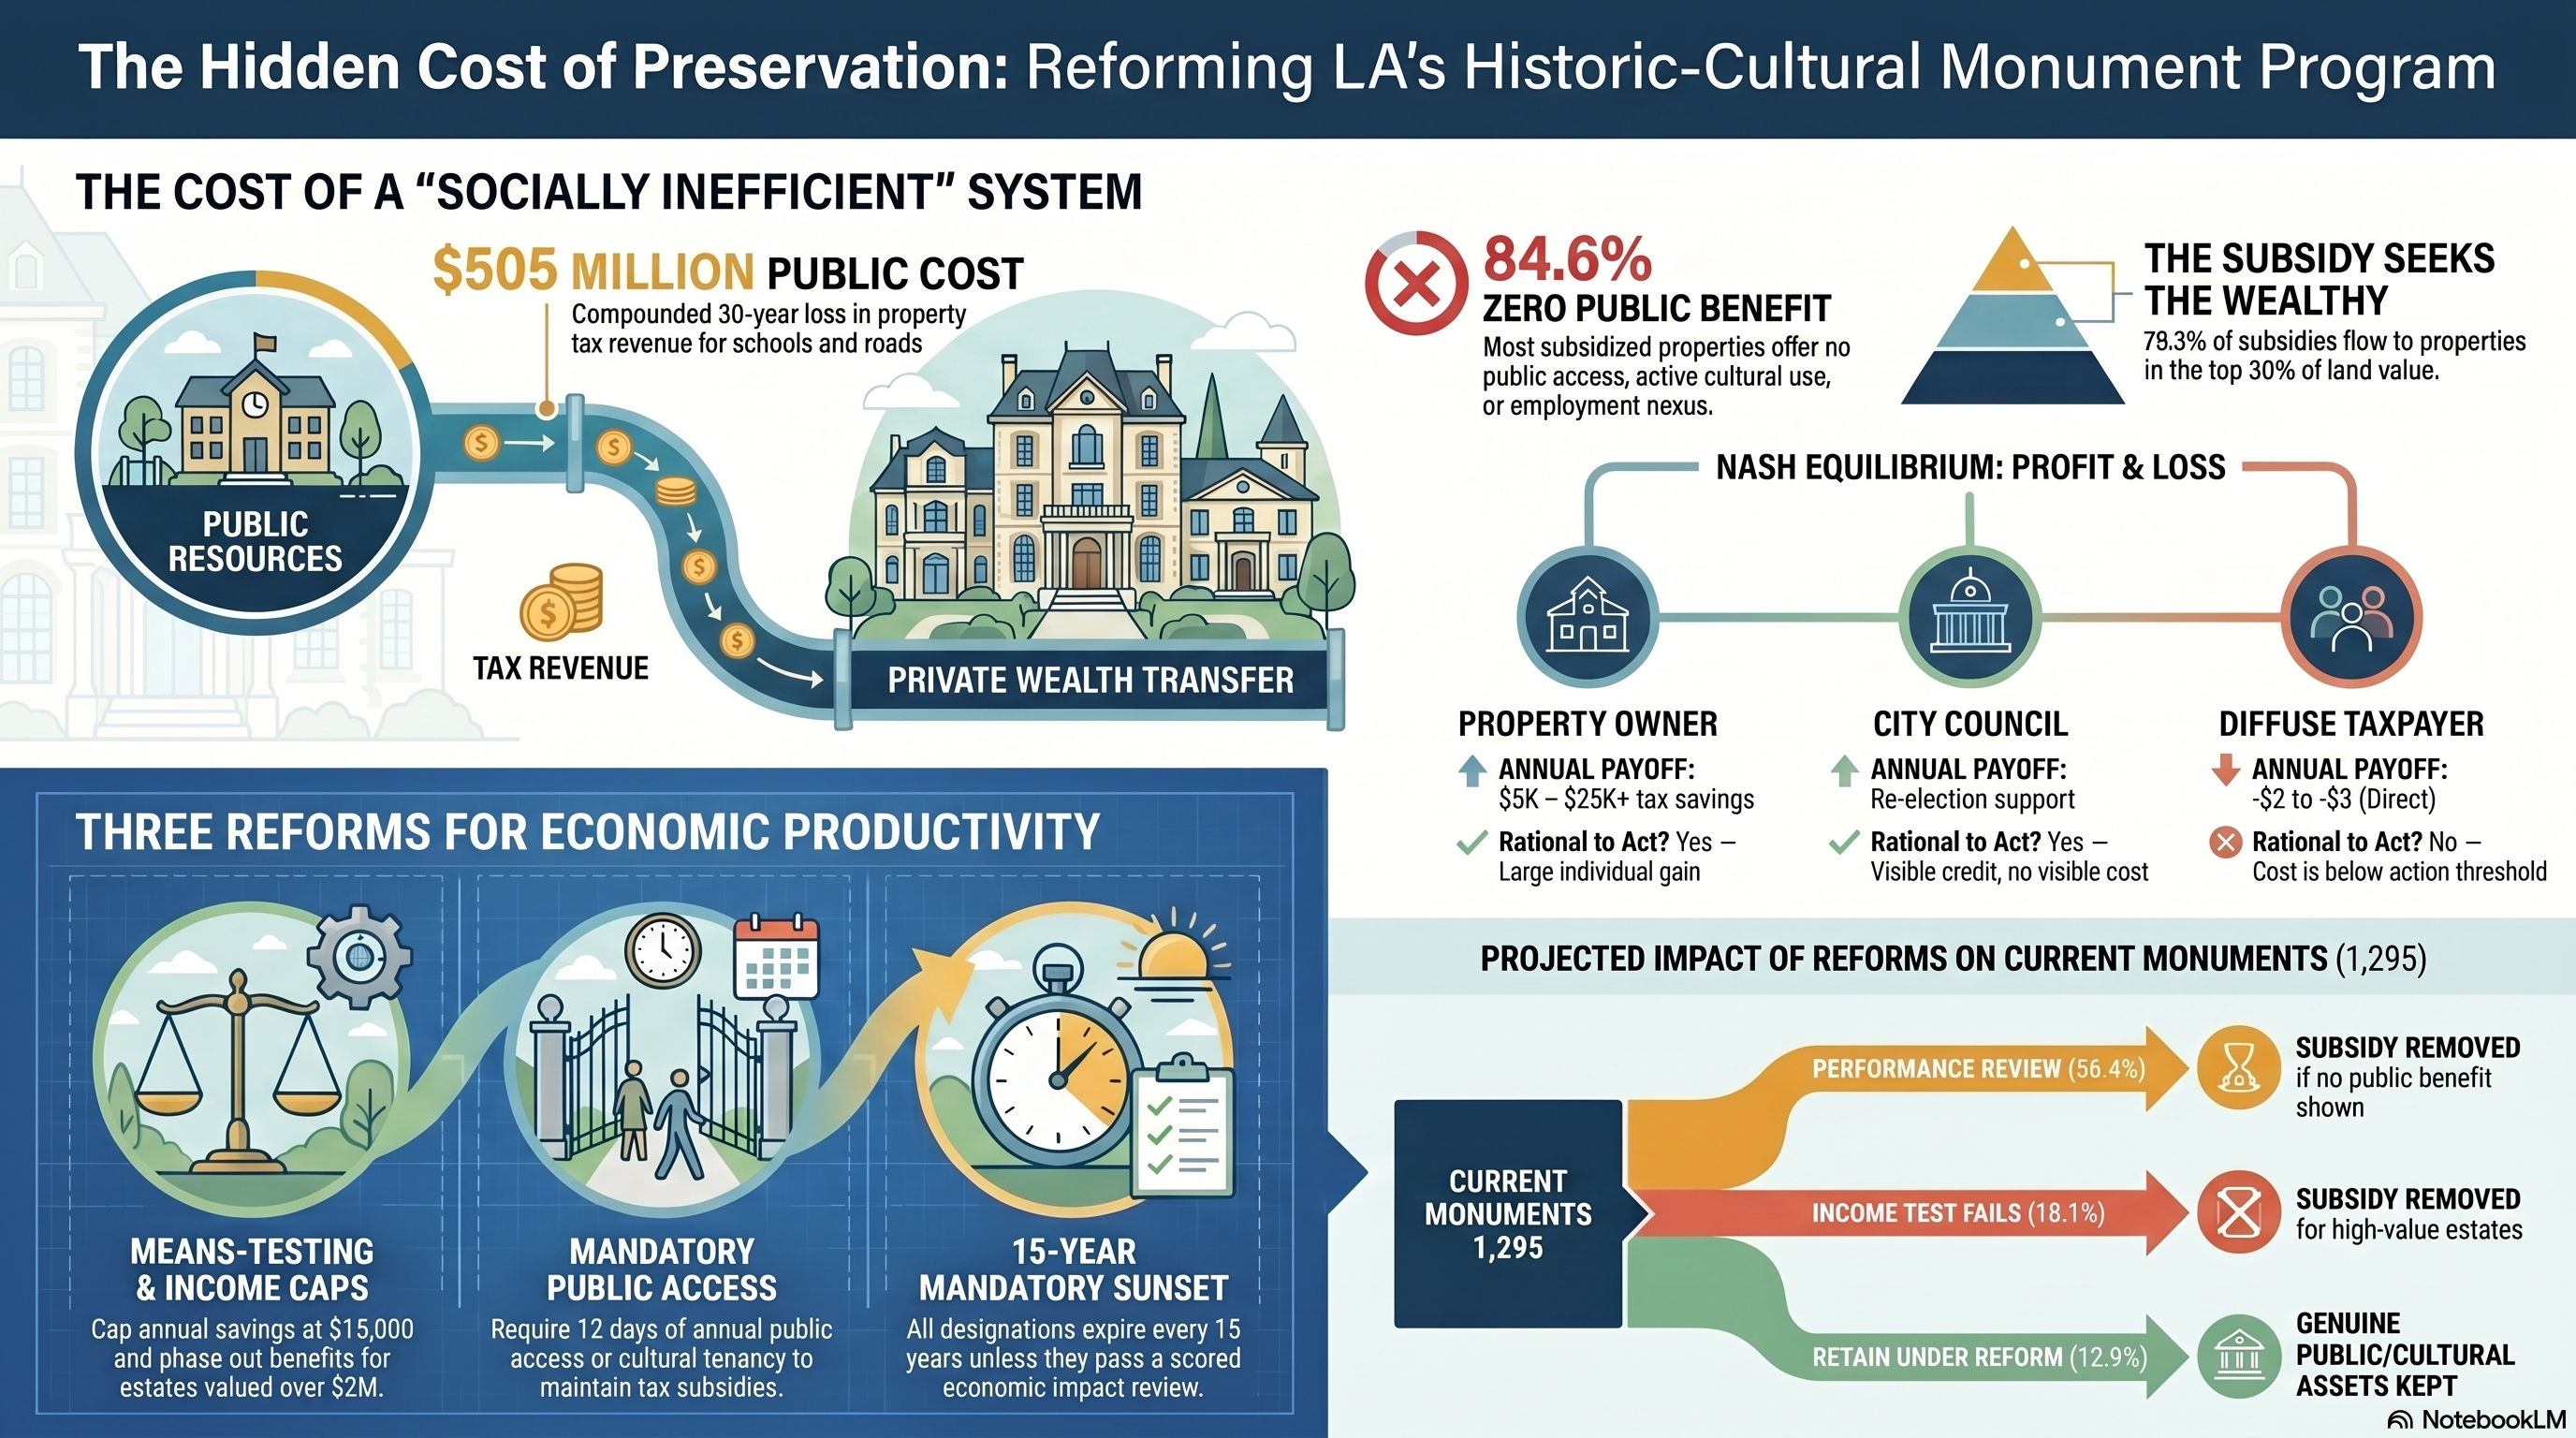
Los Angeles's Historic-Cultural Monument program was designed to protect significant architecture and support tourism. The data shows it operates primarily as a property-tax reduction vehicle for high-value real estate, brokered by a specialist professional class that profits from regulatory complexity.
The cost falls twice on everyone else. First: foregone property tax revenue that would have funded schools, parks, and road repair. Second: as wealthy landowners pay less, the pressure to fund public services falls harder on households that have no choice but to use them — because they cannot afford the private alternatives. The people receiving the subsidy are precisely those who can absorb the cuts; the people absorbing the cuts are precisely those who can't.
This report quantifies the wealth transfer, models the 30-year public cost, and proposes five structural reforms that redirect preservation toward economic productivity.
The game
Four players sit at a table. The outcome isn't a mistake or corruption — it is the predictable result of each player rationally pursuing their own best interest. That's what makes it so durable.
The Nash equilibrium
Every player is playing their best strategy given what the others are doing. No one can improve their outcome by changing — so no one changes. The result is stable, self-reinforcing, and socially inefficient.
The equilibrium has two structural features that make it unusually durable. First, concentrated benefits / diffuse costs: the winners have large individual stakes and organize accordingly; the losers have tiny individual stakes and don't. Mancur Olson described this pattern in 1965. It explains farm subsidies, oil depletion allowances, and the Mills Act with equal precision.
Second, the professional class as a ratchet: the specialist lawyers and consultants have a direct financial interest in program complexity. Simplify the Mills Act and their fee stream collapses. They therefore lobby for it, explain it, and expand it — which increases complexity, which increases fees. They don't just benefit from the system. They maintain it.
Payoff summary
| player | annual payoff | 30-yr payoff | political power | rational to act? |
|---|---|---|---|---|
| City council | Re-election support | Institutional continuity | High (decides rules) | Yes — low cost, visible credit |
| Property owner | $5K – $25K+ tax savings | $320K – $1.6M+ per property (compounded) | Medium (organized donors) | Yes — large individual gain |
| Preservation specialist | $12K – $22K per client (first year) | $65K – $100K+ per client (3 renewal cycles) | Medium (technical gatekeepers) | Yes — no capital risk, scalable |
| Diffuse taxpayer | −$2 to −$3/yr direct + degraded public services | −$30 to −$50 direct + cumulative service cuts borne by those who can't buy out | Low (unorganized, unaware) | No — direct cost below action threshold; indirect cost invisible |
| Tourism / public | Marginal at best | Zero measurable on most buildings | None (diffuse, unrepresented) | Not a player — cited, not consulted |
The tourism argument is mostly rhetorical
The public justification for the Mills Act is that it preserves buildings that support tourism and cultural vitality. Our mapping of all 536 HCMs within the Hollywood Community Plan area — the most tourist-dense district in LA — tells a different story.
The buildings that genuinely drive Hollywood tourism — the Chinese Theatre, the Walk of Fame stars, the Dolby — are preserved through institutional, commercial, and federal mechanisms that don't depend on the Mills Act. They would exist without it. The 454 peripheral HCMs would not be tourism assets regardless of their designation status. The five that are genuinely contributing make a public-benefit case; the other 531 do not.
The core problem with the tourism argument is that it is structurally unfalsifiable: you can always claim a building might contribute to cultural vitality without ever measuring whether it does. A reform framework has to make this falsifiable — measurable public benefit as a condition of ongoing tax subsidy, not a rhetorical claim at designation time.
What happens over 30 years
The Mills Act is a perpetual mechanism. Once a property enters the program the reduced assessment transfers with each sale. As LA property values appreciate the gap between market value and Mills Act assessment widens — meaning the annual subsidy grows automatically, with no legislative action required.
These estimates use current HCM stock only and a conservative 5%/yr appreciation rate. They do not include new designations added each year (roughly 40–80/yr historically), which would compound the total further. They also use tract median home values — many landmark properties are worth 2–5× the tract median, meaning actual savings for individual high-profile properties are substantially larger.
For context: a single $10M Bel Air estate under Mills Act saves approximately $56,000/yr ($10M × 0.45 discount × 1.25% tax rate). Over 30 years with appreciation, that single property represents ~$3.7M in foregone public revenue — enough to fund roughly 15 years of a teacher's salary.
Proposition 13 stacking — the invisible first layer
Mills Act contracts apply on top of Proposition 13 (1978), which freezes a property's assessed value at the purchase price and caps annual growth at 2%. For owners who have held for decades in a market that has appreciated ~5%/yr, the Prop 13 discount alone is large before Mills Act enters the picture. Mills Act then reduces the assessment further by substituting a capitalized-income restricted value for the Prop 13 floor.
AECOM Appendix A reports two figures per contract: the Prop 13 factored base year value ("trended") and the assessed value actually on the tax roll ("enrolled" — the lower of the Prop 13 floor and the Mills Act restricted value). The owner pays tax on the enrolled value. The trended value is the counterfactual: what they would pay if Mills Act were removed today.
Two methodology choices to flag. First, "trended" is the Prop 13 factored base year value — the original purchase price ratcheted up at California's 2%/yr cap. It is not fair-market value. For any owner who has held more than a few years, true market runs well above trended; Mills Act abatement against true fair-market is therefore larger than this section measures. Second, the effective tax rate (1.02%) is calibrated against AECOM's parcel-specific MA savings field rather than assuming the published 1.25% blended rate uniformly. That calibration makes our derived gap reconcile exactly with the source-of-truth dollar figure; the implied ~18% gap vs. the published rate reflects special-assessment variation across the contracted parcels.
By equity category
The AECOM equity index categorises neighborhoods by barriers to wealth-building. "Low barriers" = high-resource, high-wealth areas. The stacking effect is most extreme there: these owners hold the longest, have the largest Prop 13 discounts, and then stack Mills Act on top.
| equity category | contracts | avg enrolled / trended | annual trended tax | annual enrolled tax | annual ma savings |
|---|---|---|---|---|---|
| Low to Medium Barriers | 417 | 54.1% | $38.7M/yr | $23.9M/yr | $14.8M/yr |
| Medium to High Barriers | 358 | 55.1% | $9.4M/yr | $6.1M/yr | $3.3M/yr |
| Low Barriers | 101 | 42.5% | $3.1M/yr | $1.3M/yr | $1.8M/yr |
| High Barriers | 53 | 63.8% | $0.7M/yr | $0.5M/yr | $0.2M/yr |
Deepest abatement — top 10 cases
The ten contracts where the enrolled value is the smallest fraction of the Prop 13 trended floor. The lower the ratio, the more work Mills Act is doing on top of Prop 13.
| address | equity tier | trended (p13 floor) | enrolled (post-ma) | enrolled / trended | trended tax/yr | enrolled tax/yr |
|---|---|---|---|---|---|---|
| 121 S HUDSON AVE | Low Barriers | $9.4M | $1.1M | 12.0% | $96K | $12K |
| 8530 W HEDGES PL | Low Barriers | $6.5M | $0.8M | 12.5% | $67K | $8K |
| 2622 N GLENDOWER AVE | Low to Medium Barriers | $4.9M | $0.7M | 14.0% | $50K | $7K |
| 102 N OCEAN WAY | Low Barriers | $11.9M | $2.1M | 17.5% | $121K | $21K |
| 925 N STONEHILL LN | Low Barriers | $3.4M | $0.6M | 17.7% | $35K | $6K |
| 126 S WINDSOR BLVD | Low to Medium Barriers | $4.6M | $0.9M | 19.5% | $47K | $9K |
| 2422 N SILVER RIDGE AVE | Low to Medium Barriers | $2.6M | $0.5M | 19.6% | $27K | $5K |
| 2090 N REDCLIFF ST | Low Barriers | $2.3M | $0.5M | 19.8% | $23K | $5K |
| 1808 S BUCKINGHAM RD | Medium to High Barriers | $1.9M | $0.4M | 20.0% | $20K | $4K |
| 525 S IRVING BLVD | Low to Medium Barriers | $5.3M | $1.1M | 20.3% | $54K | $11K |
What this means for the reform framework: The income cap proposal (reform 1) was designed around Mills Act savings alone. The data here shows the Mills Act is the second tax reduction these owners receive, not the first. A cap on Mills Act savings alone leaves the Prop 13 windfall untouched — which is a state-level issue, not a city one. The city cannot override Prop 13. What it can do is refuse to add a second layer of abatement on top of it: any property already receiving a Prop 13 discount below 40% of fair-market value should be categorically ineligible for Mills Act benefits. That is the city's lever.
The new-buyer windfall — who actually gets the subsidy
Mills Act contracts run with the land (Gov. Code §50281). When a contracted property sells, the buyer inherits the Mills-Act-restricted assessment. Under Prop 13 alone, a sale resets the base year value to the new purchase price — but the inherited Mills Act contract keeps the new owner enrolled at the lower capitalized-income value instead. No re-vetting of preservation hardship, no test of public benefit, no reapplication. The buyer pays for the house and acquires a multi-decade tax abatement designed for someone else.
To measure how often this happens, we cross-referenced the 929 contracts against the LA County Assessor's current parcel roll. Prop 13 base years (roll_imp_base_year / roll_land_base_year) reset on change of ownership. When a parcel's most recent base year is later than its Mills Act contract year, the property has transferred since the contract was recorded.
Years from contract to most recent ownership change
For the 391 post-transfer contracts, the gap between contract recording and the most recent base year tells how long the inherited benefit has run.
| years from contract to base-year reset | contracts | what it means |
|---|---|---|
| 0–5 years | 113 | Sold quickly after the prior owner secured the contract |
| 6–10 years | 128 | First inheritor cohort — well past the original 10-yr term |
| 11–15 years | 80 | Second-cycle inheritance |
| 16–20 years | 51 | Multi-decade chain of post-transfer owners |
| Over 20 years | 19 | Benefit has long outlived the original applicant's tenure |
Top 10 dollar windfalls
Ranked by annual Mills Act savings, the ten largest post-transfer windfalls. These are contracts whose dollar value is now flowing to a buyer who acquired the property after the contract was already in place.
| address | contract yr | most recent base yr | gap (yr) | 2019 enrolled | 2019 trended | ma savings/yr |
|---|---|---|---|---|---|---|
| 849 S BROADWAY (HCM-294) | 2005 | 2011 | 6 | $37.3M | $128.5M | $930K |
| 727 W 7TH ST (HCM-355) | 2008 | 2016 | 8 | $66.3M | $142.1M | $774K |
| 523 W 6TH ST (HCM-398) | 2007 | 2016 | 9 | $138.8M | $212.2M | $749K |
| 6300 W HOLLYWOOD BLVD (HCM-664) | 2005 | 2017 | 12 | $43.1M | $112.7M | $710K |
| 1850 E INDUSTRIAL ST (HCM-888) | 2007 | 2011 | 4 | $33.5M | $86.0M | $535K |
| 601 W 5TH ST (HCM-347) | 2016 | 2019 | 3 | $88.3M | $130.1M | $426K |
| 108 W 2ND ST (HCM-873) | 2008 | 2017 | 9 | $34.6M | $75.0M | $412K |
| 612 S FLOWER ST (HCM-766) | 2003 | 2011 | 8 | $76.1M | $114.9M | $395K |
| 701 S HILL ST (HCM-953) | 2016 | 2018 | 2 | $29.0M | $65.8M | $375K |
| 558 S MAIN ST (HCM-806) | 2007 | 2018 | 11 | $34.9M | $70.1M | $359K |
Reform implication — re-vetting at transfer. The statutory test for a Mills Act contract is preservation hardship and public benefit, evaluated at recording. Neither test is re-run when the property changes hands. The city's lever — within state law — is to require non-renewal review at every change of ownership: the inherited contract continues only if the new owner can re-establish the preservation-hardship and public-benefit case. Properties that fail the re-vetting return to the Prop 13 floor at the next renewal cycle. This does not break any contract; it uses the annual-renewal mechanism that Mills Act already provides.
Data source: LA County Assessor lacounty_parcel MapServer, current roll (most recent assessment year). Base year resets on change of ownership or substantial new construction, so this is a strong-but-imperfect proxy for sales. A small share of "post-contract transfer" rows may reflect major renovation rather than a sale.
Where the money flows
Estimated annual tax forgone and 30-year public cost by neighbourhood cluster.
| neighbourhood | HCMs | annual forgone | 30-yr public cost | top building |
|---|---|---|---|---|
| Eagle Rock / Highland Park | 133 | $797K | $53.0M | Eagle Rock |
| Brentwood / Bel Air | 72 | $778K | $51.7M | Site of Founders Oak |
| Koreatown | 113 | $748K | $49.7M | Crocker Bank Building |
| Downtown | 161 | $712K | $47.3M | Oliver G. Posey - Edward L. Doheny Resid |
| West Hollywood | 65 | $656K | $43.6M | Storer House |
| Los Feliz | 66 | $648K | $43.0M | Cedar Trees |
| Hollywood | 72 | $622K | $41.3M | Two Stone Gates |
| Silver Lake / Echo Park | 96 | $619K | $41.1M | Silverlake and Ivanhoe Reservoir |
| Mid-Wilshire | 54 | $468K | $31.1M | Palm Trees (Queen & Washingtonia Robusta |
| West Adams / Crenshaw | 55 | $341K | $22.7M | Fitzgerald House |
| San Fernando Valley (East) | 42 | $250K | $16.6M | Saint Saviour's Chapel Harvard School |
| Westwood / Century City | 27 | $232K | $15.4M | Greenacres (Former Harold Lloyd Estate) |
| San Fernando Valley (West) | 43 | $227K | $15.1M | Kaye Residence |
| Culver City / Venice | 24 | $224K | $14.9M | Venice Canal System |
| San Pedro / Wilmington | 28 | $119K | $7.9M | Wilbur F. Wood House |
30-year public cost is the sum of each building's annual saving compounded at 5%/yr for 30 years (geometric series multiplier ≈ 66.4× the year-1 annual). Neighborhood totals sum to the headline $$505M.
Top 50 buildings by estimated annual tax savings
Conservative estimates using tract median home values. Actual savings for landmark properties in high-value neighbourhoods are likely 2–5× higher. Owner name and actual assessed value would require LA County Assessor parcel lookup (public record — see assessor.lacounty.gov using each building's address).
data.lacounty.gov — flagged here as the next data step.
| # | building | neighbourhood | annual saving est. | owner gain 10yr | owner gain 30yr | public cost 30yr | reform status |
|---|---|---|---|---|---|---|---|
| 1 | Two Stone Gates Intersection of Beachwood Drive, Belden Drive, and Westshire Drive | Hollywood | $11K | $129K | $0.7M | $0.7M | Sunset candidate |
| 2 | Saint Saviour's Chapel Harvard School 3700-3946 Coldwater Canyon Avenue | San Fernando Valley (East) | $11K | $129K | $0.7M | $0.7M | Retain under reform |
| 3 | Site of Founders Oak Haverford Avenue (Between Sunset Boulevard and Antioch Street) | Brentwood / Bel Air | $11K | $129K | $0.7M | $0.7M | Sunset candidate |
| 4 | Cedar Trees Los Feliz Boulevard (between Riverside Drive and Western Avenue) | Los Feliz | $11K | $129K | $0.7M | $0.7M | Performance review needed |
| 5 | Palm Trees (Queen & Washingtonia Robusta) and the Median Strip Highland Avenue (between Wilshire and Melrose) | Mid-Wilshire | $11K | $129K | $0.7M | $0.7M | Performance review needed |
| 6 | Storer House 8161 Hollywood Boulevard | West Hollywood | $11K | $129K | $0.7M | $0.7M | Performance review needed |
| 7 | Gabrielino Indian Site Fern Dell (Griffith Park) | Los Feliz | $11K | $129K | $0.7M | $0.7M | Performance review needed |
| 8 | Tierman House 2323 Micheltorena Street | Los Feliz | $11K | $129K | $0.7M | $0.7M | Income test fails |
| 9 | Samuel - Novarro House 5601-5609 Valley Oak Drive and 2255 Verde Oak Drive | Los Feliz | $11K | $129K | $0.7M | $0.7M | Performance review needed |
| 10 | Coral Trees (Erythrina Caffra) Between 26th & Bringham San Vicente Boulevard (between 26th and Bringham) | Brentwood / Bel Air | $11K | $129K | $0.7M | $0.7M | Sunset candidate |
| 11 | Ennis - Brown House 2607 Glendower Avenue | Los Feliz | $11K | $129K | $0.7M | $0.7M | Performance review needed |
| 12 | Chateau Marmont 8225 Marmont Lane, 8215-8221 Sunset Boulevard, and 8244 Monteel Road | West Hollywood | $11K | $129K | $0.7M | $0.7M | Performance review needed |
| 13 | Animation School for the Walt Disney Studios from 1935-1940 2660-2664 & 2701-2739 North Hyperion Avenue; 2646-2664 & 2710-2746 Griffith Park Boulevard, 3616-3618 Monon Street & 3027-3033 Angus Street | Los Feliz | $11K | $129K | $0.7M | $0.7M | Performance review needed |
| 14 | Site of Burial Place of J. B. Lankershim (North End) Nichols Canyon Road | West Hollywood | $11K | $129K | $0.7M | $0.7M | Performance review needed |
| 15 | Laurelwood Apartments 11833-11847 Laurelwood Drive | San Fernando Valley (East) | $11K | $129K | $0.7M | $0.7M | Income test fails |
| 16 | El Greco Apartments 817-823 North Hayworth Avenue | West Hollywood | $11K | $129K | $0.7M | $0.7M | Performance review needed |
| 17 | Marymount High School (Main Administration Building, including Chapel and Auditorium) 10643-10685 Sunset Boulevard and 101-121 Marymount Place | Brentwood / Bel Air | $11K | $129K | $0.7M | $0.7M | Performance review needed |
| 18 | Edward's House 5642 Holly Oak Drive | Los Feliz | $11K | $129K | $0.7M | $0.7M | Performance review needed |
| 19 | Venice Canal System Roughly bounded by Grand Canal, Carroll Canal, Eastern Canal, and Sherman Canal | Culver City / Venice | $11K | $129K | $0.7M | $0.7M | Sunset candidate |
| 20 | Pacific Palisades Business Block 15300-15318 Sunset Boulevard, 904-910 Via de la Paz, and 15301-15327 Antioch Street | Brentwood / Bel Air | $11K | $129K | $0.7M | $0.7M | Performance review needed |
| 21 | Greenacres (Former Harold Lloyd Estate) 1056 North Maybrook Drive | Westwood / Century City | $11K | $129K | $0.7M | $0.7M | Performance review needed |
| 22 | C.E. Toberman Estate 1847 Camino Palmero | West Hollywood | $11K | $129K | $0.7M | $0.7M | Adaptive reuse candidate |
| 23 | Crocker Bank Building 269-273 South Western Avenue and 4359-4363 West 3rd Street | Koreatown | $11K | $129K | $0.7M | $0.7M | Performance review needed |
| 24 | Arzner / Morgan Residence 2249 Mountain Oak Drive | Los Feliz | $11K | $129K | $0.7M | $0.7M | Performance review needed |
| 25 | The Grove 10669-10683 Santa Monica Boulevard | Westwood / Century City | $11K | $129K | $0.7M | $0.7M | Performance review needed |
| 26 | The Lindbrook 10800-10808 Lindbrook Drive | Westwood / Century City | $11K | $129K | $0.7M | $0.7M | Performance review needed |
| 27 | Shulman House 7875-7877 Woodrow Wilson Drive | West Hollywood | $11K | $129K | $0.7M | $0.7M | Performance review needed |
| 28 | Wilshire Tower 5500-5522 Wilshire Boulevard | Mid-Wilshire | $11K | $129K | $0.7M | $0.7M | Performance review needed |
| 29 | Engine Company No. 56 2838 Rowena Avenue | Los Feliz | $11K | $129K | $0.7M | $0.7M | Performance review needed |
| 30 | Case Study House #8 - The Eames House and Studio and Grounds 203 Chautauqua Boulevard | Brentwood / Bel Air | $11K | $129K | $0.7M | $0.7M | Performance review needed |
| 31 | Higgins / Verbeck / Hirsch Mansion 637 South Lucerne Boulevard | Mid-Wilshire | $11K | $129K | $0.7M | $0.7M | Performance review needed |
| 32 | Wilshire Branch Library 149 North Saint Andrews Place | Koreatown | $11K | $129K | $0.7M | $0.7M | Performance review needed |
| 33 | Silverlake and Ivanhoe Reservoir Silver Lake Boulevard, West Silver Lake Drive, Armstrong Avenue, and Tesla Avenue | Silver Lake / Echo Park | $11K | $129K | $0.7M | $0.7M | Sunset candidate |
| 34 | Andalusia Apartments 1471-1475 Havenhurst Drive | West Hollywood | $11K | $129K | $0.7M | $0.7M | Income test fails |
| 35 | Eastern Star Home (including Front Grounds and Courtyard) 11725 Sunset Boulevard | Brentwood / Bel Air | $11K | $129K | $0.7M | $0.7M | Performance review needed |
| 36 | Courtney Desmond Estate 1801-1811 Courtney Avenue | West Hollywood | $11K | $129K | $0.7M | $0.7M | Adaptive reuse candidate |
| 37 | Courtyard Apartment Complex 10830 Lindbrook Drive | Westwood / Century City | $11K | $129K | $0.7M | $0.7M | Performance review needed |
| 38 | Courtyard Apartment Complex 10836-10840 Lindbrook Drive | Westwood / Century City | $11K | $129K | $0.7M | $0.7M | Performance review needed |
| 39 | Sycamore Trees Bienveneda Avenue | Brentwood / Bel Air | $11K | $129K | $0.7M | $0.7M | Performance review needed |
| 40 | Nicolosi Estate 414 Saint Pierre Road | Brentwood / Bel Air | $11K | $129K | $0.7M | $0.7M | Performance review needed |
| 41 | Tischler Residence 175 Greenfield Avenue | Brentwood / Bel Air | $11K | $129K | $0.7M | $0.7M | Performance review needed |
| 42 | Taggart House 2150-2158 Live Oak Drive and 5423 Black Oak Drive | Los Feliz | $11K | $129K | $0.7M | $0.7M | Performance review needed |
| 43 | Case Study House #9 - John Entenza House 205 Chautauqua Boulevard | Brentwood / Bel Air | $11K | $129K | $0.7M | $0.7M | Performance review needed |
| 44 | Hollywoodland's Historic Granite Retaining Walls and Stairs Hollywoodland | Hollywood | $11K | $129K | $0.7M | $0.7M | Sunset candidate |
| 45 | Farmers Market West 3rd Street / Fairfax Avenue and Gilmore Lane | West Hollywood | $11K | $129K | $0.7M | $0.7M | Adaptive reuse candidate |
| 46 | Lloyd Wright's Headley - Handley House 3003 Runyon Canyon Road | West Hollywood | $11K | $129K | $0.7M | $0.7M | Performance review needed |
| 47 | Thomas A. Churchill Sr. Residence 215 South Wilton Place | Koreatown | $11K | $129K | $0.7M | $0.7M | Income test fails |
| 48 | Sturges House 441-449 Skyewiay Road | Brentwood / Bel Air | $11K | $129K | $0.7M | $0.7M | Performance review needed |
| 49 | Wattles Park (Mansion and Garden) 1824-1850 North Curson Avenue, 1701-1755 Sierra Bonita Avenue, and 7561 Hollywood Boulevard | West Hollywood | $11K | $129K | $0.7M | $0.7M | Performance review needed |
| 50 | Feuchtwanger House (Villa Aurora) 520 Paseo Miramar | Brentwood / Bel Air | $11K | $129K | $0.7M | $0.7M | Performance review needed |
From outdoor museum to economic engine — five reforms
The goal is not to end historic preservation. It is to make the program do what it claims to do: create public benefit, protect genuinely significant structures, and support the kind of active urban fabric that generates tourism and community vitality. Right now it does the opposite — it freezes high-value land in low-density uses while transferring wealth from diffuse taxpayers to concentrated landowners.
Income-cap the Mills Act at $15,000/yr per property
Cap the annual tax savings any single Mills Act agreement can generate at $15,000 (2024 dollars, CPI-indexed). Phase out benefits for properties with current assessed value above $2M. This preserves the program for middle-class owners of genuine historic homes who need the break to afford maintenance — the original policy intent — while eliminating the subsidy for estates and commercial landmarks whose owners have no maintenance constraint.
Require annual certification of measurable public benefit
To renew Mills Act benefits each year, a property must demonstrate at least one of the following: (a) public access on at least 12 days per year (open house, guided tours, community events); (b) active commercial or cultural tenancy on the ground floor; (c) documented educational programming (school visits, artist residency, civic organisation use); or (d) registered non-profit cultural institution in occupancy. Pure private residences with zero public engagement are ineligible for the tax subsidy regardless of architectural significance.
Adaptive reuse overlay for blocked-redevelopment HCMs
For the 97+ HCMs our audit classifies as blocking redevelopment or trapping lower-density uses on premium land, create a by-right adaptive reuse pathway: the owner may redevelop to 6-story mixed-use density if and only if the original building's street facade, structural type, and at least one interior character space are incorporated into the new structure. Mills Act benefits end; the owner receives a reduced affordable-unit requirement (8% vs. the standard 15%) as the one-time incentive.
This converts static outdoor museum pieces into active mixed-use buildings that generate property tax, sales tax, and housing supply while retaining the physical character that justified designation. The Barcelona and London models have demonstrated this works at scale.
Activate a transfer of development rights market
Allow HCM property owners to voluntarily sell their unused development rights (the difference between what they could build by-right and what the HCM designation freezes them at) to receiving zones within a 1-mile radius. The city operates a TDR bank that sets a floor price and facilitates transactions. Developers use purchased rights to build above the standard height limit in receiving zones.
Result: the HCM owner is compensated in cash for the preservation constraint, at market rate, with no ongoing public subsidy. The developer builds more housing. The city retains full property tax on both sites. The historic building is preserved because the owner is financially whole — not because the city is bribing them annually.
Mandatory 15-year sunset with economic impact review
All HCM designations — existing and new — sunset automatically after 15 years unless renewed. Renewal requires passing a scored economic impact assessment administered by the Office of Historic Resources with input from the city's economic development department. The assessment scores four dimensions:
- Tourism contribution — documented visitor traffic, accommodation of tour operators, presence in official tourism materials
- Community access — days per year accessible to the public, educational programming, civic use
- Neighbourhood investment — does the property anchor active street-level activity, or is it a sealed private enclave?
- Opportunity cost — what housing units, jobs, or tax revenue are foregone by keeping the site frozen?
Properties that score above the threshold retain designation and Mills Act eligibility. Properties that fail are converted to a "historic landmark" status that provides legal recognition without tax subsidy — or qualify for the adaptive reuse pathway (reform 3).
Combined effect
These five reforms do not abolish historic preservation. They redirect it. The buildings that genuinely deserve protection — where designation is preserving something irreplaceable and the owner is providing real public value — retain their status and their subsidy. The buildings where designation is functioning as a tax-avoidance vehicle lose the subsidy but gain a clear, economically productive path forward.
The mechanism that makes the current system stable — the professional intermediary class that profits from complexity — is disrupted by reforms 1 and 2 (automatic means-testing removes the largest-margin clients) and by reform 5 (sunset forces re-application, which does generate professional fees but only for buildings that can demonstrate performance). The overall fee extraction opportunity shrinks because the subsidy population shrinks.
The public gets: more housing, more tax revenue, more active street-level culture, and a preservation programme that can make a credible tourism argument because it is actually tied to tourism performance. The city gets: an economic-development tool instead of an outdoor museum administration burden.
Current HCM stock under proposed reform framework
Applying the five-reform framework to the 1,295 active HCMs based on current classification:
Data & methodology
Tax savings model: Market value estimated as tract median home value (ACS 5yr 2023 via ESRI Living Atlas) for the Census tract containing each HCM. Mills Act assessed value estimated as 55% of market value (45% abatement applied to income-capitalisation approach, midpoint of the 30–60% range observed in publicly available LA Mills Act agreements). Annual tax savings = market value × 0.45 × 1.25% (LA County blended tax rate). This is a conservative lower bound — many landmark properties significantly exceed their tract median, and the actual abatement can reach 60%+ for high-end residential.
30-year projection: Annual savings compounded at 5%/yr (historical LA residential appreciation, Case-Shiller, 1991–2023 average). Does not account for new designations added each year, which would increase totals.
Professional fee model: $10,000 upfront application and CHC preparation fee; 20% of first-year savings as contingency (market rate for LA preservation specialists); $1,800/yr ongoing compliance. These represent typical rates — actual fees vary by property complexity and attorney.
Property ownership: Individual owner names and actual assessed values are public records held by the LA County Assessor. Cross-referencing HCM addresses to assessor parcel numbers via the Socrata API at data.lacounty.gov would produce the definitive per-building ownership picture. This pipeline is not yet built.
Reform impact estimates are directional, not actuarial. They assume full implementation and no behavioural response (owners who lose Mills Act eligibility may pursue alternative preservation agreements). A formal fiscal impact analysis by the City Administrative Officer would be required before legislation.