Los Angeles has produced fewer consequential local land-use reforms in the last decade than
the State of California has produced for it. Mayor Bass's ED1 is the major local
exception, and even ED1 carved out the HPOZ system that does most of the blocking. This
study uses Mancur Olson's framework on distributional coalitions to argue that LA's
reform deficit is not a failure of political will but a structural feature: the coalitions
enforcing sclerosis are private-sector professionals whose revenue depends on the friction
itself, and who cannot be voted out.
4stacked veto layers in LA approvals
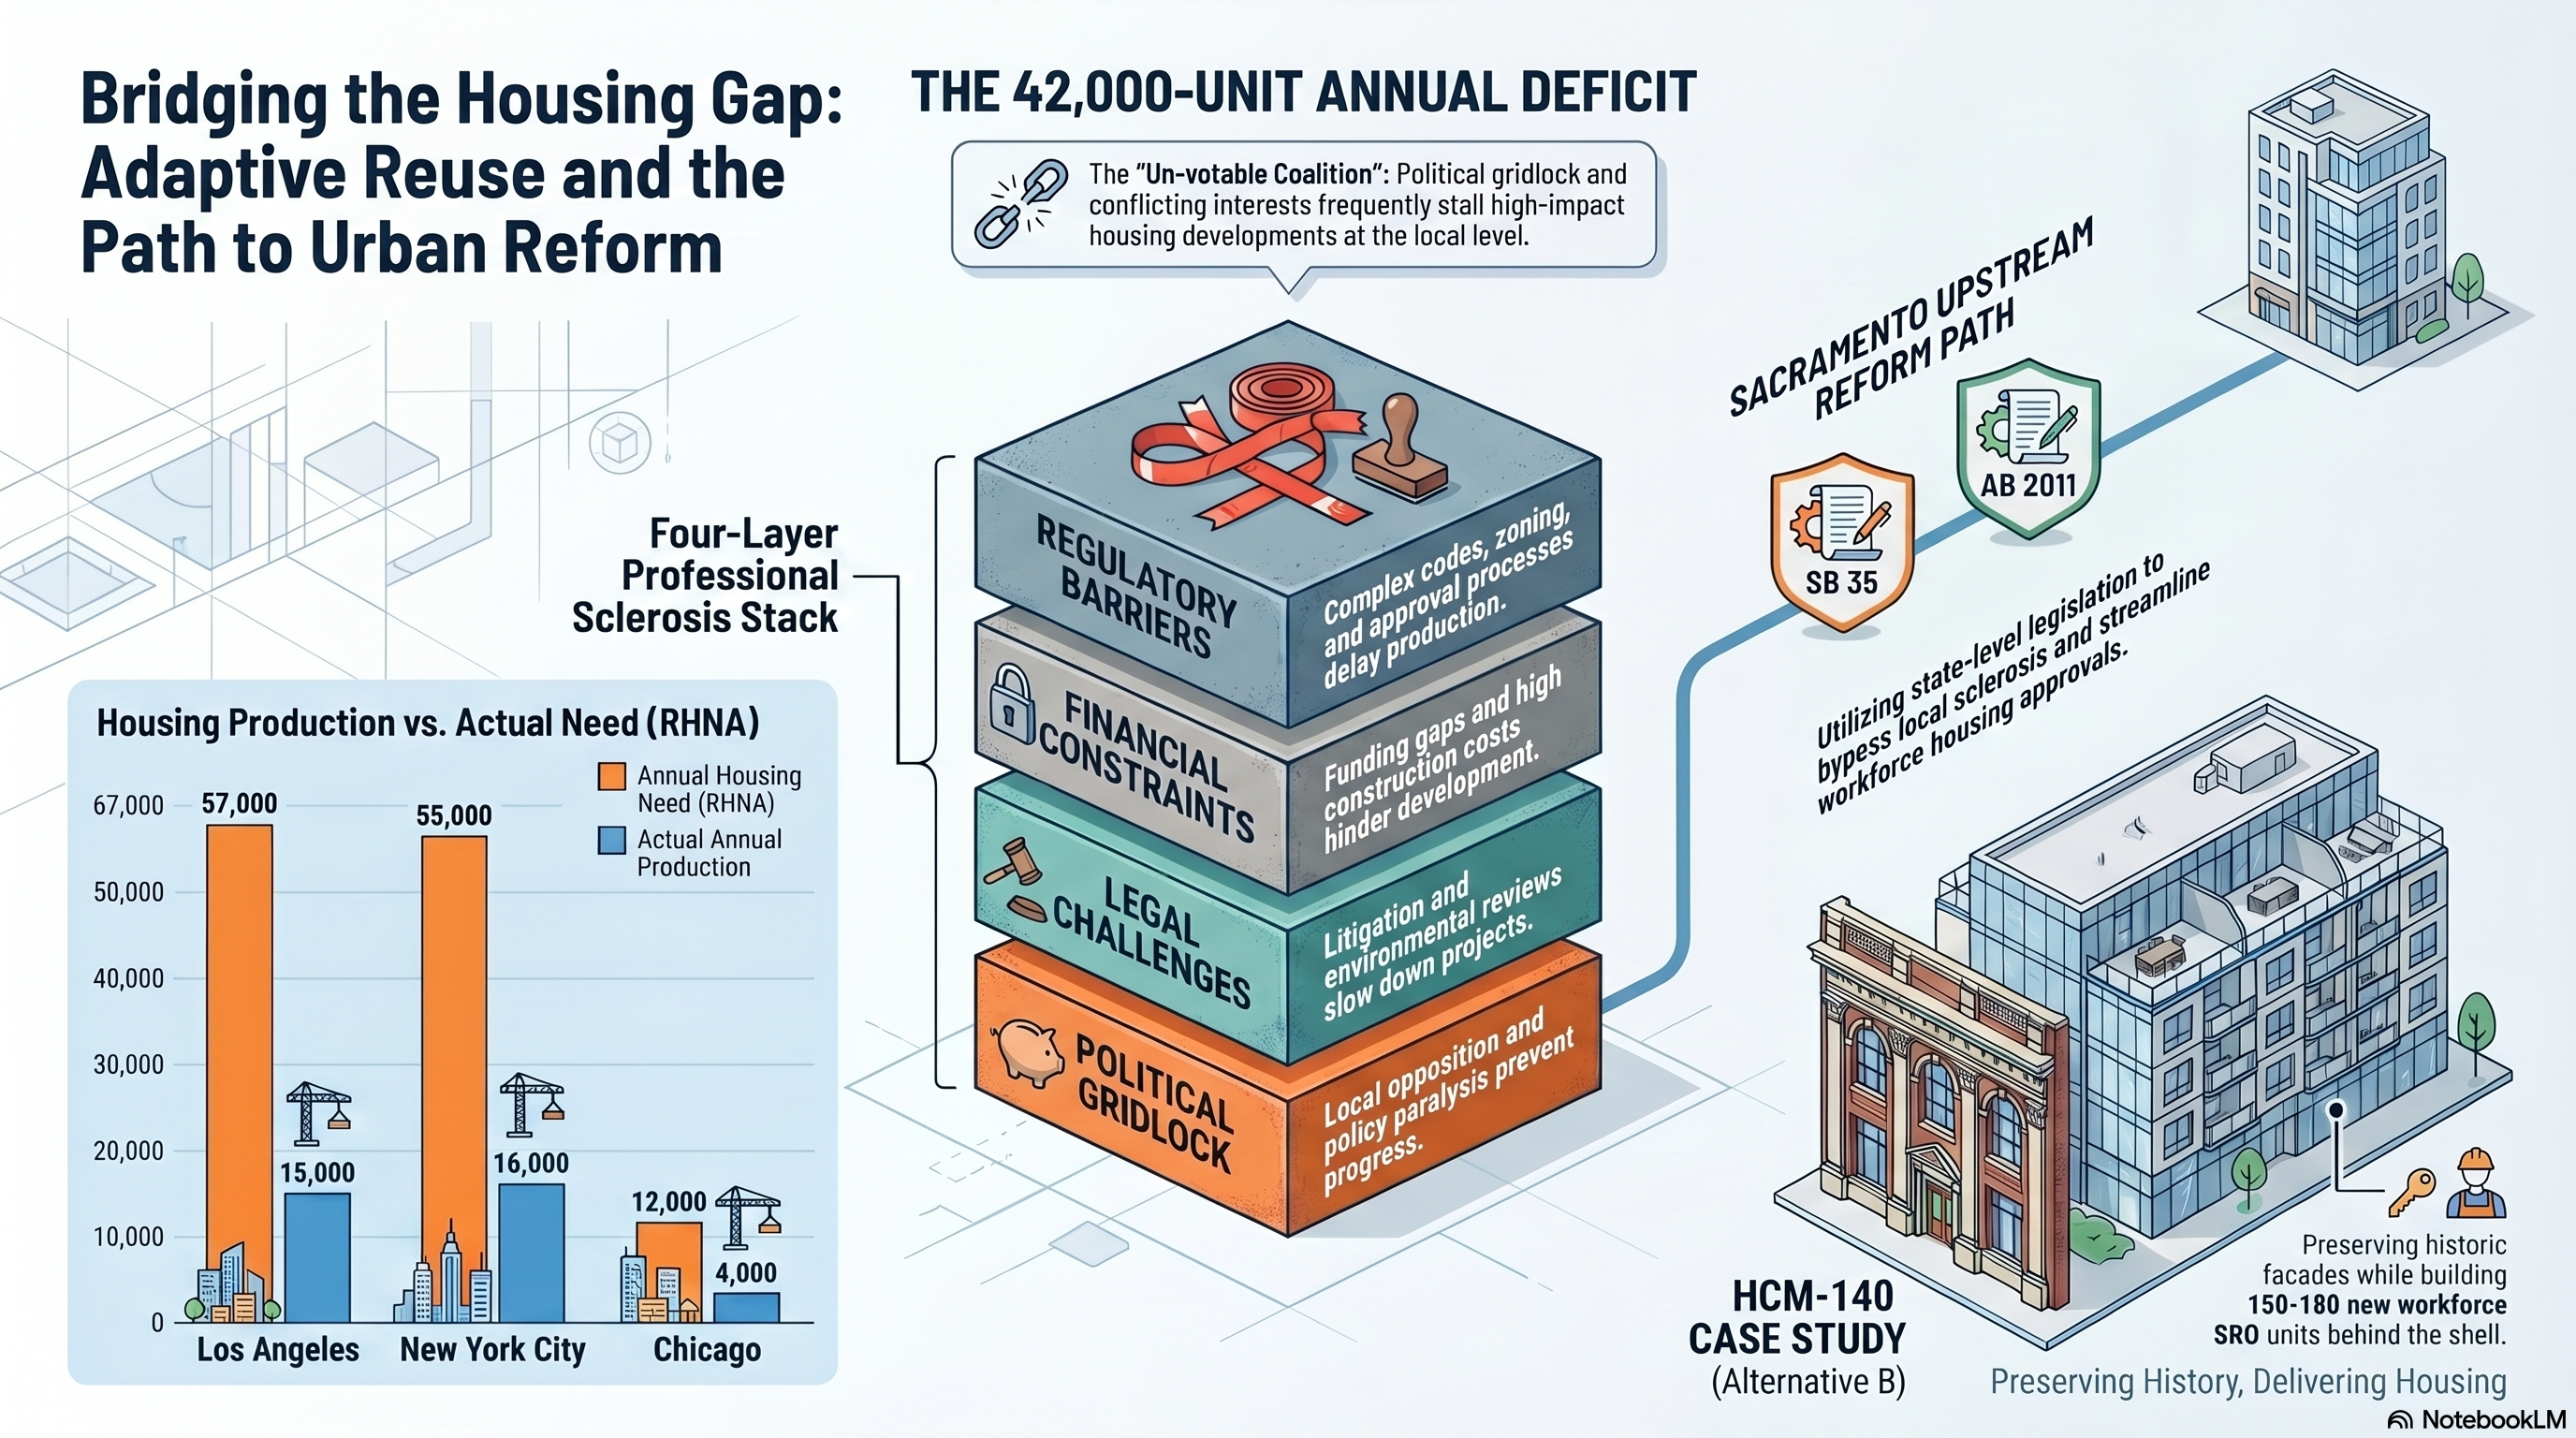
~42Kannual housing units below RHNA need
5major reforms passed in Sacramento, 2017-2023
1comparable reform passed locally (ED1, 2022)
headline finding
LA's sclerosis is enforced by a private-sector ecosystem, not a political machine.
Chicago's veto runs through 50 alderpersons who can be persuaded or replaced. New York's
runs through 51 council members in a system designed to make their bargains visible. Los
Angeles's runs through a professional coalition — preservation consultants, CEQA attorneys,
EIR firms, neighborhood council infrastructure — whose business model requires the friction
to persist and whose members face no electoral accountability for the costs they impose.
This is why reform that succeeds in Sacramento often stalls at City Hall: the local
coalitions cannot be defeated by the same instruments that defeat political coalitions
elsewhere.
analytic frame
Olson's distributional coalitions, applied to municipal governance
The Olson hypothesis
In The Rise and Decline of Nations (1982), Mancur Olson argued that long-stable
societies accumulate distributional coalitions — narrow interest groups that
pursue redistribution over production. Over time these coalitions raise transaction
costs, slow decision-making, and depress economic dynamism. His comparative test was
post-war Germany and Japan, where coalitional structures had been disrupted, against
the UK, where they had not.
What it predicts for a city
Cities that have been politically continuous for long periods, without coalitional
disruption, will accumulate more friction over time. The friction will be most
concentrated where decisions touch property and capital allocation — land use,
procurement, public-sector compensation. The coalitions will resist reform in
proportion to the rents they extract from the existing equilibrium.
What it does not predict
Olson did not predict the character of the coalition. In some places the
coalition is labor (public-sector unions). In others it is geographic (ward bosses).
In Los Angeles, this study argues, it is professional: the rents flow to private firms
that produce process documents, design review responses, and environmental impact
reports — not to elected officials, not to public-sector workers, not to ward
organizations.
la sclerosis stack
Four veto layers, one professional base
CEQA litigation exposureCalifornia 1970 statute extended by courts to most discretionary approvals; any third party may sue on procedural grounds
HPOZ + HCM preservation35 Historic Preservation Overlay Zones covering roughly 21,000 parcels; about 1,300 individual landmarks; ED1 carve-out preserves the mechanism
Neighborhood council political record99 chartered councils; no formal veto but generate the political record that elected officials respond to
Multi-commission charter structureCitywide-elected Controller and City Attorney; semi-autonomous LADWP and Harbor commissions; 15-member Council with strong local prerogative on land use
Each layer can independently delay or block a project. The professional base is what gives
the stack its durability: each layer has a constituency of firms and consultants whose
revenue depends on it remaining in place.
calibration
Three cities, three veto architectures
The comparison is calibrated, not symmetrical. New York and Chicago appear here as
reference points that clarify what makes LA's case distinct, not as co-subjects.
Los Angeles
procedural exposure
mechanism
CEQA litigation risk, HPOZ design review, neighborhood council friction, multi-commission charter structure
Lowest — bargains held inside process, not in public vote
where reform happens
State legislature (Sacramento)
The coalitions are private-sector and accountable to fee-paying clients, not voters. Reform that requires defeating them locally is structurally hard because they cannot be voted out.
New York City
political bargaining
mechanism
ULURP, council member deference, Landmarks Preservation Commission
coalition
DC 37, UFT, PBA, uniformed services, council political infrastructure
coalition type
Labor-political
transparency of bargains
Highest — bargains are explicit, reported, and renegotiable when coalitions shift
where reform happens
City Council (City of Yes, 2024)
The bargain is visible: a member can be moved with capital commitments, a council shift can pass a rezoning. The friction is high but legible.
Chicago
territorial control
mechanism
Aldermanic prerogative over zoning, permits, licensing; severe pension overhang
coalition
50 ward political networks layered with collapsed public-sector pension funds
coalition type
Territorial-political plus fiscal
transparency of bargains
Medium — informal but visible at ward level
where reform happens
State legislature (pension reform requires constitutional change)
Fiscal sclerosis has compounded political sclerosis. Pension obligations now consume a structurally rising share of the operating budget, narrowing the space in which reform can be funded.
evidence: housing production
All three cities underproduce, but the gaps differ
Annual production versus need, recent multi-year averages. Need figures: LA from SCAG
RHNA 6th cycle (456,643 over 8 years); NYC and Chicago from independent housing-need
studies. Production averages from local permit data. All figures approximate.
evidence: pension funded ratios
Chicago's fiscal sclerosis is structurally severe
Chicago police (PABF)22%
Chicago fire (FABF)24%
Chicago municipal (MEABF)28%
LACERS (LA city employees)71%
LAFPP (LA fire and police)84%
NYCERS (NYC employees)80%
NYC police pension fund76%
Funded ratio = plan assets divided by accrued actuarial liability. A healthy plan is
typically reported as 80%+. Chicago's three largest city plans sit at roughly a quarter
of that benchmark, producing rising actuarial contributions that crowd out discretionary
spending. LA and NYC plans sit in the moderately-stressed range characteristic of large
urban systems but do not present the same structural collapse.
evidence: population dynamics
Sclerosis correlates with stagnation
+0.4%Los AngelesEssentially flat; net domestic out-migration since 2017
+1.8%New York CityPeaked 2019; declining post-2020
-1.9%ChicagoContinuous decline through the decade
2010-2023 city population change. All three cities are net losers to lower-friction metros
(Phoenix, Dallas, Atlanta, Nashville, Tampa). The cumulative effect over a decade is
comparable to the loss of a mid-size city in each case.
why LA is hardest
The private-sector coalition has no electoral counterweight
Chicago
A reform-minded mayor faces 50 alderpersons. Each is replaceable on a four-year cycle.
When alderpersons fall, prerogative weakens. The 2019 ADU ordinance, the 2024
citywide signage reform, and recent zoning carve-outs all moved by attrition of
individual ward holdouts.
New York
Member deference can be broken by a council coalition shift or a borough-level deal.
City of Yes passed in 2024 because a coalition of members concluded the local political
cost of continued underproduction had exceeded the cost of yielding deference.
Los Angeles
CEQA reform proposals are routinely killed not by elected officials but by professional
associations — the bar, planning consultants, environmental review firms — that submit
testimony through municipal-policy coalitions. These bodies cannot be voted out. They
absorb reform pressure by participating in process rather than by negotiating
substance. The Mills Act and HPOZ administration show the same pattern in microcosm:
programs ostensibly serving a public goal, captured at the implementation layer by
the consulting class that runs the paperwork.
where reform actually happens
The Sacramento pattern, 2017-2023
The most productive recent reforms to Los Angeles's land-use system were enacted in
Sacramento, not at City Hall. Each one bypassed a layer of local sclerosis by moving the
decision upstream to a venue where LA's local coalitions have less leverage.
SB 35 (2017)
Streamlined ministerial approval for housing meeting RHNA targets
Removes discretionary review where cities are not meeting state housing goals
SB 9 (2021)
By-right duplex and lot-split on most single-family parcels
Eliminates a class of local discretionary review entirely
AB 2011 (2022)
By-right housing on commercial corridors with labor standards
Direct legislative response to corridor underdevelopment in cities like Los Angeles
SB 423 (2023)
Extends and strengthens SB 35; closes local exemptions through 2036
Narrows the exemptions that LA had used to limit SB 35 reach
AB 1633 (2023)
Restricts use of CEQA "no project" approvals to block housing
Removes a frequent local-control mechanism in LA approvals
The pattern is not coincidence. State legislators face a different coalitional landscape
than city councilmembers: statewide constituencies dilute the LA professional coalition's
weight, and statewide housing politics has organized counterweights (YIMBY, building
trades, the Governor's office) that have no local equivalent in the LA Planning
Commission or City Council.
implication
Reform must move further upstream, or local coalitions must be made visible
Two paths follow. The first is to keep moving reform to Sacramento — and where Sacramento
is not enough, to the federal level via housing finance, transportation conditioning, and
environmental statute reform. This path treats LA's local political system as a binding
constraint and routes around it.
The second is to make the local coalitions visible. The professional-procedural coalition
operates today behind a wall of technical legitimacy: CEQA opposition is filed in the name
of environmental review, HPOZ objections in the name of historic preservation, neighborhood
council resolutions in the name of community input. Disaggregating the fee flows — who is
paid, by whom, for what process — would convert opaque procedural friction into legible
political bargaining, which is the regime under which NYC operates and where reform has
become feasible.
Neither path is easy. The first cedes local democratic agency to upstream venues. The
second requires institutional disclosure that the coalition itself controls. But the
alternative — continued accumulation of friction in a stable system — is what Olson
predicted, and what the housing, fiscal, and population evidence already shows.
Figures cited in the text are approximate where so noted. Pension funded ratios are
reported as of the most recent available actuarial valuations (Chicago figures: 2023
actuarial; LA and NYC: 2023-2024). Housing production figures are multi-year averages
from local permit data and may differ from individual-year totals.