preserve architecturally significant buildings
policy study - city of los angeles - 1781-2026
the los angeles externality atlas
Predictable externalities of planning, preservation, and policy in 11 decision nodes.
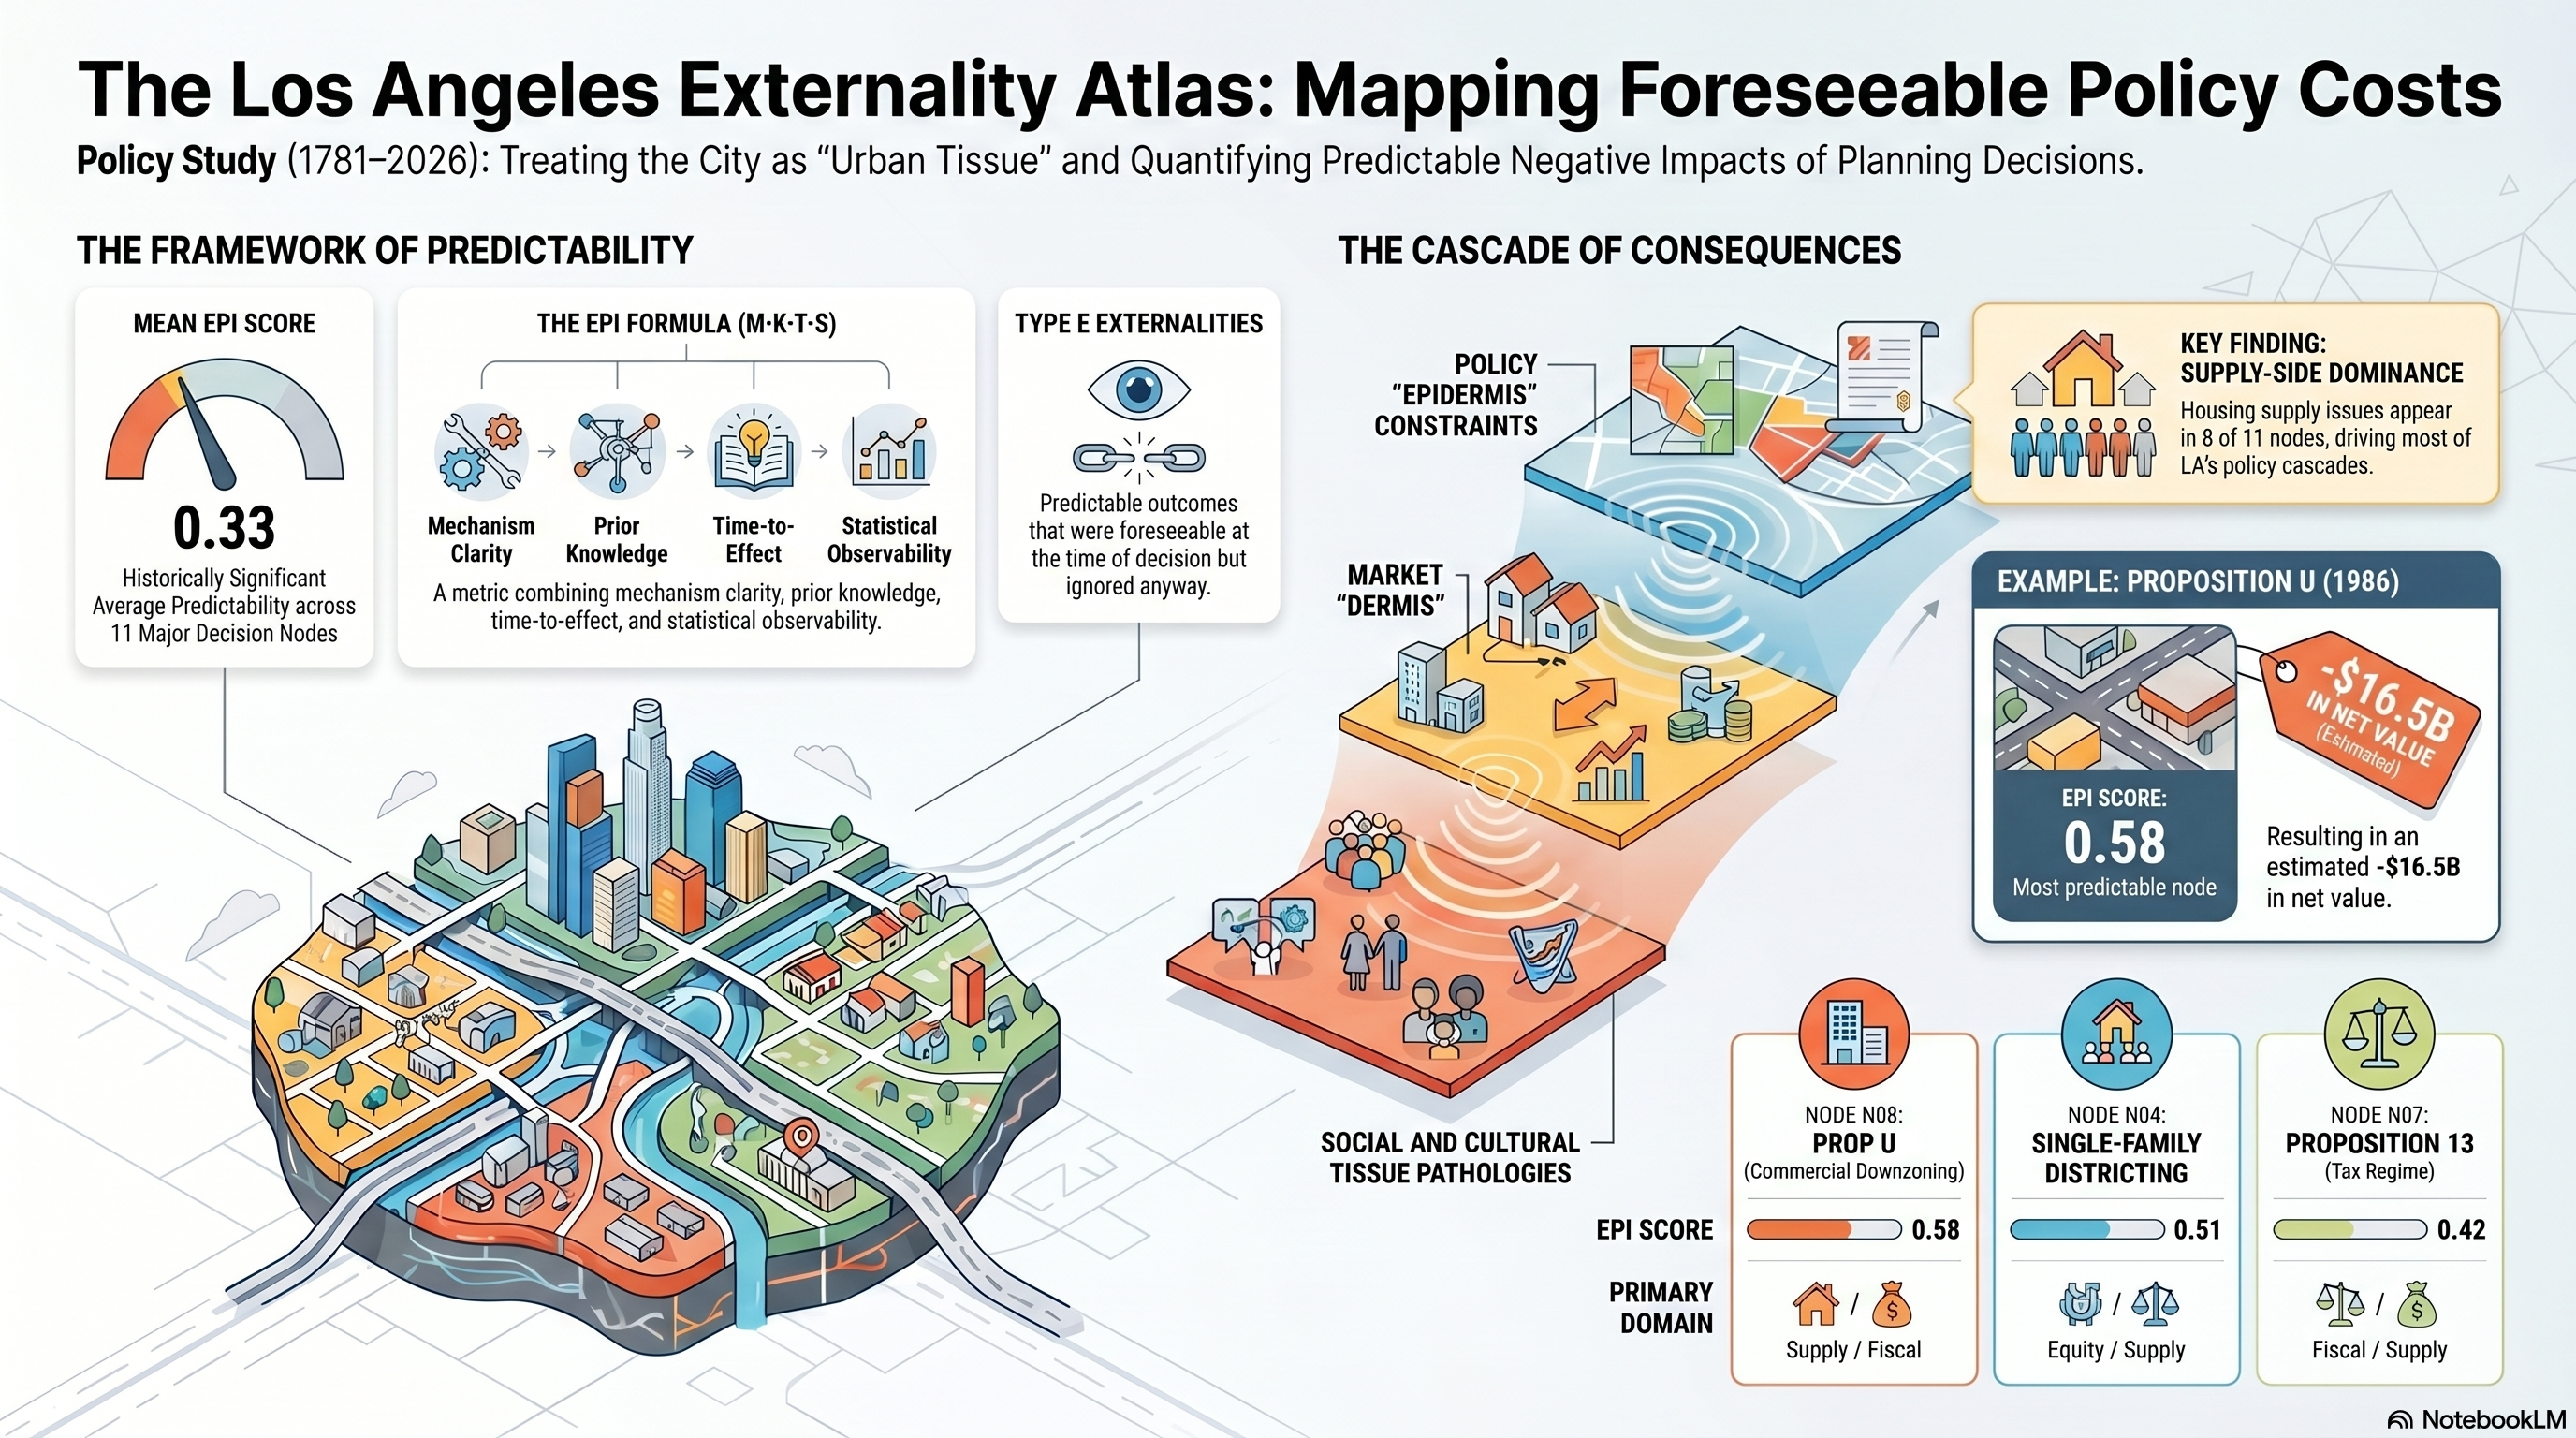
Los Angeles did not merely suffer unintended consequences. It accumulated predictable externalities from policy decisions whose costs were often displaced across time, geography, and class. The atlas defines those externalities, attaches each to measurable statistics, and renders alternative-branch algebra: NPV(P) = Σ [B + X⁺ − X⁻ − C] / (1+r)t, with an Externality Predictability Index (EPI = M·K·T·S) on every node.
11 decision nodes (1781 - 2026)
2 / 11 nodes with EPI ≥ 0.50 (foreseeable+)
0.34 mean EPI across the catalog
P2 / P6 build phases shipped
framing
From counterfactual history to externality algebra.
The atlas is not a list of mistakes and it is not historical fan fiction. It is an externality ledger. For each of eleven decisions, the page records what the policy was for, what it produced as a positive spillover, what it produced as a negative spillover, who won, who paid, and what plausible or evidence-backed alternative would have generated a different externality bundle. Every claim carries its evidentiary tier, and every externality carries its Externality Predictability Index — because the study's focus is Type E externalities: foreseeable at the time of the decision, ignored anyway.
taxonomy
Six externality types — the study lives in Type E
limit demolition or redevelopment rights
neighborhood identity, tourism, cultural continuity
reduced housing capacity, displacement pressure
downzoning during population growth produces scarcity
rare shock, tech change, disaster interaction
Type E — externalities that were predictable at the time of the decision and accepted as the price of doing business — is where the policy work is. The atlas tags each node's primary externality type as part of its EPI bin.
cross-section
The city as urban tissue
"Histological" is borrowed from biology, where it names tissue-level study. The atlas uses it as a visualization layer for causal stack — policy at the epidermis, capital in the dermis, infrastructure as vasculature, households as social tissue, identity as cultural tissue, and predictable externalities as the pathology that accumulates across all of them.
Policy epidermis rules ordinances, plans, overlays, approvals
Market dermis capital rents, land values, construction costs, financing
Infrastructure vasculature systems roads, transit, water, power, sewers
Social tissue households migration, displacement, homelessness
Cultural tissue memory landmarks, streetscape, identity
Pathology accumulation predictable externalities compounding over time
timeline
Eleven decision nodes, 1781 – 2026
predictability at a glance
EPI score, every node — ranked
confidence × predictability
Where each node sits on the record vs the forecast
domain coverage
How many of the eleven nodes touch each domain
filter
Filter the ledger by domain
externality ledger
Per-node: intended benefit, positive ext, negative ext, distribution, EPI
Pueblo founding / Spanish colonial grid
1781·path dependence
0.04 EPI · weakly predictable
0.75 record M · inferred
- actors
- Spanish colonial administration; Tongva displacement uncosted in the original record
- intended benefit (B)
- Defensible settlement adjacent to LA River for irrigation and trade
- positive externality (X⁺)
- Established the civic core that anchored 250+ years of identity and trade routes
- negative externality (X⁻)
- Path-locked LA into a flood-plain footprint and a water-rights regime that later required the 1913 aqueduct
- benefit to
- Spanish colonial state; later settlers
- burden on
- Tongva and other Indigenous nations; downstream water users
- alternative · plausible
- Grid sited away from flood-vulnerable river plain; explicit common-water charter
- EPI factors
- M=0.40 K=0.30 T=0.60 S=0.50
- domains hit
- landwater
First land-use zoning ordinance
1908·separation of uses
0.21 EPI · weakly predictable
0.85 record M · documented
- actors
- City Council; industrial districts mapped first to protect single-family pockets
- intended benefit (B)
- Nuisance reduction; separation of noxious industry from residential pockets
- positive externality (X⁺)
- Predictable land-use patterns reducing ad hoc nuisance conflicts
- negative externality (X⁻)
- Established the legal scaffold for later exclusionary zoning and separation of home from job
- benefit to
- Single-family neighborhoods; pioneering planning movement
- burden on
- Future renters and minority residents excluded from amenity areas
- alternative · plausible
- Use-based mixing with nuisance enforcement; no a-priori separation of housing from work
- EPI factors
- M=0.75 K=0.55 T=0.65 S=0.80
- domains hit
- supplyequity
LA Aqueduct + annexation regime
1913·externalized resource cost
0.29 EPI · plausible
0.90 record M · documented
- actors
- Mulholland / Board of Water Commissioners; Owens Valley landowners as net losers
- intended benefit (B)
- Reliable water supply enabling metropolitan growth
- positive externality (X⁺)
- Agglomeration economies; agricultural and industrial expansion
- negative externality (X⁻)
- Unlocked metropolitan growth; transferred ecological and equity costs upstream to the Owens Valley
- benefit to
- LA growth coalition; settlers; downtown business
- burden on
- Owens Valley farmers; ecosystem; downstream Mono Basin
- alternative · plausible
- Negotiated multi-jurisdiction water compact; growth capped to local watershed yield
- EPI factors
- M=0.85 K=0.70 T=0.60 S=0.80
- domains hit
- supplyenvironment
Single-family districting + restrictive covenants
1920s·Tiebout sorting + collective action
0.51 EPI · foreseeable
0.90 record M · documented
- actors
- Homeowner associations; subdividers; courts (until Shelley v. Kraemer, 1948)
- intended benefit (B)
- Stable residential neighborhoods with property-value protection
- positive externality (X⁺)
- Predictable lot patterns; preserved bungalow streetscape that endures today
- negative externality (X⁻)
- Hardened the racial wealth gap and removed roughly two-thirds of the city from multifamily eligibility
- benefit to
- White homeowners; subdividers
- burden on
- Black, Latino, Asian, Jewish households excluded from majority of the city
- alternative · evidence-backed
- Form-based code permitting low-rise multifamily citywide; race-neutral covenants voided earlier
- EPI factors
- M=0.95 K=0.80 T=0.75 S=0.90
- domains hit
- equitysupply
Freeway buildout / Boyle Heights routing
1947–65·irreversibility
0.37 EPI · plausible
0.90 record M · documented
- actors
- Division of Highways (Caltrans precursor); federal Interstate funds; displaced residents
- intended benefit (B)
- Regional mobility; postwar interstate connectivity
- positive externality (X⁺)
- Faster commerce, port-airport-rail integration, decentralized employment
- negative externality (X⁻)
- Severed neighborhoods, locked LA into car dependency, displaced an estimated 10,000+ households
- benefit to
- Suburban commuters; logistics sector; auto industry
- burden on
- Boyle Heights, Sugar Hill, other Black and Latino neighborhoods; future air-quality victims
- alternative · evidence-backed
- Rail-anchored regional mobility (preserving Pacific Electric); freeways routed around dense neighborhoods
- EPI factors
- M=0.90 K=0.70 T=0.70 S=0.85
- domains hit
- mobilityequityenvironment
Redevelopment / urban renewal demolitions
1948–70·externalized displacement cost
0.41 EPI · plausible
0.90 record M · documented
- actors
- Community Redevelopment Agency; lenders; tenants without standing
- intended benefit (B)
- Slum clearance; modern downtown; infrastructure modernization
- positive externality (X⁺)
- Civic-center icons; institutional anchor sites; some adaptive-reuse pipelines
- negative externality (X⁻)
- Bunker Hill and Chavez Ravine erased dense, affordable housing stock; replacement towers under-housed prior residents
- benefit to
- Downtown business; institutional developers; later baseball franchise
- burden on
- Bunker Hill tenants; Palo Verde, La Loma, Bishop residents of Chavez Ravine
- alternative · evidence-backed
- Rehabilitation grants conditioned on right-of-return; no demolition without one-for-one replacement
- EPI factors
- M=0.95 K=0.80 T=0.60 S=0.90
- domains hit
- displacementculture
Proposition 13 — fiscal regime lock
1978·rent-seeking coalition
0.42 EPI · plausible
0.90 record M · documented
- actors
- Statewide electorate; commercial property owners as durable beneficiaries
- intended benefit (B)
- Property-tax relief for homeowners on fixed incomes
- positive externality (X⁺)
- Reduced involuntary displacement of long-term homeowners during the 1970s inflation
- negative externality (X⁻)
- Decoupled property tax from market value; concentrated incumbency benefits; pushed cities toward sales-tax-chasing land use
- benefit to
- Long-tenured homeowners; commercial property owners (Disneyland still assessed at 1975 value)
- burden on
- Renters; new buyers; local services dependent on property tax
- alternative · plausible
- Split-roll reform; assessment cap on owner-occupied only
- EPI factors
- M=0.85 K=0.70 T=0.75 S=0.95
- domains hit
- fiscalsupply
Proposition U — commercial downzoning
1986·capacity removal
0.58 EPI · foreseeable
0.85 record M · documented
- actors
- Homeowner federations; reaction to mid-1980s growth
- intended benefit (B)
- Protect single-family neighborhoods from commercial encroachment
- positive externality (X⁺)
- Stabilized corridor scale; predictable streetscape preservation in some areas
- negative externality (X⁻)
- Halved commercial floor area allowed on most corridors; one of the single largest cuts to zoned capacity in any US city
- benefit to
- Single-family homeowners adjoining commercial corridors
- burden on
- Renters; future commercial tenants; transit-corridor potential; fiscal yield per acre
- alternative · plausible
- Targeted form regulation on corridors; preserved as-of-right commercial intensity near transit
- EPI factors
- M=0.95 K=0.85 T=0.80 S=0.90
- domains hit
- supplyfiscal
HPOZ + HCM designations without re-review
1980s–90s·conservation vs supply trade-off · stale designation
0.34 EPI · plausible
0.80 record M · documented
- actors
- Office of Historic Resources; neighborhood preservation councils; absent re-review schedule
- intended benefit (B)
- Preserve architectural and cultural heritage of historic neighborhoods
- positive externality (X⁺)
- Tourist value; community identity; embodied-carbon retention; adaptive-reuse pipelines where conditions permit
- negative externality (X⁻)
- Cultural preservation is sound in the global scope. In the specifics: HPOZ and HCM designations from the 1970s–90s lock buildings against redevelopment with no periodic re-review, including structures now functionally unlivable. Foregone units, lost tax base per acre, and public-safety burdens of long-vacant designated structures sit off the original designation ledger.
- benefit to
- Existing owners in designated districts; preservation councils; heritage tourism; status quo on parcel-level review
- burden on
- Renters seeking new supply; neighbors of long-vacant unlivable HCMs; public-safety budgets; growth pressure absorbed by adjacent lower-income neighborhoods
- alternative · evidence-backed
- Object-scale landmarking; mandatory periodic re-review (10–15y cadence) with condition-based delisting; designation files required to disclose foregone-unit estimates; structural-safety override that releases parcels uninhabitable for N years
- EPI factors
- M=0.80 K=0.75 T=0.70 S=0.80
- domains hit
- culturesupply
CEQA litigation normalization
1990s–2010s·tragedy of the anti-commons
0.38 EPI · plausible
0.75 record M · inferred
- actors
- Plaintiff groups; appellate courts; project sponsors as serial defendants
- intended benefit (B)
- Environmental review of major projects
- positive externality (X⁺)
- Public input mechanism; impact disclosure; genuine environmental protections in some cases
- negative externality (X⁻)
- Added veto-player layers; predictable delay added to project pro-formas; chilled by-right multifamily
- benefit to
- Plaintiff bar; project opponents; environmental consultants
- burden on
- Infill housing; renters; transit ridership; future climate co-benefits
- alternative · plausible
- Categorical exemptions for transit-proximate infill; loser-pays for project-blocking suits
- EPI factors
- M=0.85 K=0.70 T=0.75 S=0.85
- domains hit
- supplylegal
TOC, ED1, RHNA, SB-era reforms
2017–26·coordination failure (partial)
0.17 EPI · weakly predictable
0.85 record M · documented
- actors
- State legislature; LADCP; Mayor’s Office; affordable-housing builders
- intended benefit (B)
- Statewide housing-supply correction; transit-oriented density
- positive externality (X⁺)
- Documented unit gains where applied; reduced veto-player power; faster approvals on ED1 tracks
- negative externality (X⁻)
- Partial correction to the cascade; meaningful unit gains where used, but uneven coverage and continued litigation friction
- benefit to
- Affordable-housing builders; future renters; transit corridors
- burden on
- Existing homeowner expectations in some areas; uneven litigation friction in non-applying jurisdictions
- alternative · plausible
- Wider by-right upzoning paired with anti-displacement guarantees
- EPI factors
- M=0.75 K=0.65 T=0.50 S=0.70
- domains hit
- supplyequity
worked example · n08
Proposition U (1986) — NPV, EPI, and a bundle comparison
Numbers below are illustrative, labeled inferred · M=0.75.
They show how the apparatus on this page would carry a real estimate without overclaiming.
Phase 4 will replace the point estimates with confidence bands.
NPV(N08)
B    = $0.50 B/yr   intended benefit (corridor stability)
X⁺   = $0.10 B/yr   positive externality (streetscape continuity)
X⁻   = $1.50 B/yr   foregone commercial floor area + tax base
C    = $0.05 B/yr   admin / CEQA layering

annual net = B + X⁺ - X⁻ - C
           = -0.95 B/yr

NPV (r=0.03, t=40y) = annual_net · annuity_factor
                              = -22.0 B (raw)

NPV adjusted by M (0.75)
                              = -16.5 B
EPI(N08) = M · K · T · S
M = 0.95   mechanism clarity     (capacity → scarcity is mechanical)
K = 0.85   prior knowledge       (US zoning literature pre-1986)
T = 0.80   time-to-effect        (15–25y to fully express)
S = 0.90   statistical observability (permits, rents, vacancies)

EPI = 0.95 · 0.85 · 0.80 · 0.90
    = 0.581    "foreseeable"
NPV waterfall — annual flow before the discount
Each step shows the running balance for one year of Prop U effects, illustrative. B and X⁺ go right; X⁻ and C go left. The grey "annual net" bar at the bottom is the signed sum that gets multiplied by the annuity factor and the evidence multiplier M.
Externality bundle — N08 actual vs three alternatives, by domain
Each cluster is one domain. Within a cluster, four bars compare branches. Per-domain scores on a −8…+8 scale: + = public value generated, − = externality imposed. The shape of each branch is the point — Alt C ("TOC + tenant guard") tilts positive across more domains than any other branch.
Show the underlying table
| branch | supply | rent | culture | fiscal | equity | climate |
|---|---|---|---|---|---|---|
| Actual: Prop U (downzone) | -8 | -7 | +3 | -4 | -6 | -5 |
| Alt A: corridor form code | +4 | +2 | +4 | +3 | +2 | +3 |
| Alt B: pure as-of-right | +8 | +5 | -4 | +6 | +2 | +5 |
| Alt C: TOC + tenant guard | +6 | +4 | +1 | +4 | +6 | +5 |
ΔPolicy = NPV(Alt) − NPV(Actual). The best branch is not the one with no harm; it is the one with the highest net value and the lowest catastrophic downside.
n09 case detail
Preservation failure mode in the specifics
Cultural preservation has real public value: streetscape continuity, embodied-carbon retention, identity, tourism. At the global scope the case is sound. The Type E externality lives in the specifics — and the specifics are the part preservation proponents typically do not put on the ledger.
the mechanism
- Unlivable but locked. Buildings designated as Historic-Cultural Monuments (HCMs) or sitting inside HPOZs can become functionally unlivable — structural failure, fire damage, deferred maintenance, sealed infrastructure — and still cannot be redeveloped without onerous discretionary review.
- No re-review schedule. Designations from the 1970s–90s have rarely been re-reviewed against current conditions. A 1982 listing can still bind a 2026 redevelopment proposal after decades of vacancy or condemnation.
- Missing from the cultural-value case. Preservation advocates count amenity, identity, and heritage tourism on the public-benefit side. They do not typically account for foregone housing units, lost tax base per acre, or the public-safety burden of long-vacant designated structures.
cataloged cases — PDC HCM-1200 series
The HCM-1200 series audits individual designations against current use and condition. Several cases sit on parcels where the structure is unlivable but the designation persists with no scheduled re-review.
- HCM-587 Lincoln Heights Jail vacant for decades, HCM-protected
- HCM-790 Belmont Tunnel sealed infrastructure, HCM-protected
- HCM-140 Cast Iron Commercial architecturally significant + failing
The plausible alternative for N09 is not "no preservation." It is preservation with mandatory periodic re-review (10–15y cadence), condition-based delisting, designation files that disclose foregone-unit estimates, and a structural-safety override that releases parcels where the building has been uninhabitable for N years.
mechanism
The externality cascade — each leaf tagged with its driver nodes
game-theory frame
Simplified payoff matrix
| stakeholder | city chooses: upzone + build | city chooses: preserve + restrict |
|---|---|---|
| Homeowners (H) | Medium | High |
| Renters / future residents (R) | High | Low |
| Developers (D) | High | Low / Medium |
| Preservation (P) | Medium | High |
| Fiscal yield (F) | High | Medium / Low |
| Emissions (E) | Medium / High | Low / Medium |
| Homelessness pressure (U) | Lower | Higher |
| Political friction (C) | High short-term | High long-term |
Dominant trap: incumbents receive concentrated benefits from restriction; non-residents and future residents pay diffuse, invisible losses. The people most harmed often cannot vote in the jurisdiction, cannot attend hearings, or do not yet live in the city.
algebra
Three formulas the page actually uses
NPV(P)   = Σ_t [ B_t + X⁺_t − X⁻_t − C_t ] / (1+r)^t

ΔPolicy  = NPV(Alternative) − NPV(Actual)

EPI      = M · K · T · S
           M = mechanism clarity
           K = prior knowledge from literature / history
           T = time-to-effect visibility
           S = statistical observability
domain weights (atlas v1 defaults)
- housing supply 0.20
- rent burden 0.15
- displacement 0.15
- homelessness 0.10
- fiscal yield 0.10
- commute time 0.08
- emissions 0.07
- infrastructure cost 0.05
- cultural value 0.05
- legal / process cost 0.03
- health burden 0.02
EPI bins
- 0.00 – 0.25 weakly predictable
- 0.25 – 0.50 plausible
- 0.50 – 0.75 foreseeable
- 0.75 – 1.00 highly predictable
Net node scores are model outputs, not moral truth. Both weights and EPI factors are published constants so a reader can argue with them.
visual rule
Counterfactual quality scale
NOT rendered as a visual
"what if LA became Paris"
Rendered, labeled with the tier
"what if a recorded proposal from year T had been adopted"
Rendered, labeled, sourced inline
"what if a documented alternative with observed elasticities was used"
Fantasy counterfactuals are not rendered as visuals on this site. Every node's alternative carries its tier on the card. v1 has zero evidence-backed visuals; that is Phase 5's job.
build plan
Six phases, two shipped
- P1 Scope lock · done
11 decision nodes, domain weights, evidence multipliers, fact/sim seam discipline.
- P2 Atlas v1 · done
This page: ledger schema, NPV+EPI apparatus, cross-section, timeline, per-node cards, cascade with driver tags, bundle comparison, formula, counterfactual scale.
- P3 Source base · next
Populate every node with per-claim citations: LA Times, ordinances, Census, LAHSA, OHR, peer-reviewed papers.
- P4 Quant model · queued
Externality-bundle table for every node; confidence bands instead of point estimates; dollar conversion factors per domain.
- P5 Simulation visuals · queued
Side-by-side reality vs alternative for the three highest-EPI nodes (N04, N08, N06).
- P6 Public narrative · queued
Article series, deck, policy brief — "LA accumulated predictable externalities. It did not simply suffer unintended consequences."
value
Emergent and cascading value layers
L0
Raw prompt / concept proposal seeds, framing
$5K – $50K L1
Phased research plan grant nucleus, civic roadmap
$25K – $250K L2
White paper + dataset foundations, advocacy, media
$150K – $1.5M L3
Interactive simulator universities, agencies, cities
$250K – $10M L4
Decision-support engine agencies, philanthropies
$1M – $40M L5
Urban twin / civic AI urban-tech, replicable cities
$10M – $75M+ L6
Policy-impact / avoided cost society, taxpayers, renters
$100M – $100B+ Layers compound. The upper bands assume the artifact stays citable: confidence-labeled, sourced, and willing to say what it does not know.
in this series
Adjacent PDC studies of LA policy
Sources
- LA City Planning — Housing Element
- LA Office of Historic Resources — Program Overview
- City of Los Angeles — History
- LAHSA — Greater Los Angeles Homeless Count
- HistoricPlacesLA inventory
- ScienceDirect — zoned capacity & housing production
- ScienceDirect — urban morphology
- Wikipedia — Shelley v. Kraemer
- Wikipedia — California Proposition 13 (1978)
- Wikipedia — Chavez Ravine
- Wikipedia — Pacific Electric
- Wikipedia — California Environmental Quality Act
Atlas v1 lists general entry points. Phase 3 will replace these with per-claim citations and add primary sources for every node card.